Python is one of the world’s most popular programming languages. OpenTelemetry is a modern collection of tools and specifications for adding telemetry to your software. Today we’re going to learn about using OpenTelemetry with Python.
Pillars of Observability
Designing a software application to be observable is table stakes in modern software development. Observability is a non-functional requirement that when done right enables the state of a system to be continuously communicated and visible to those maintaining it. Because observability is a non-functional requirement, it has more to do with the way the system is designed than any specific feature.
The modern path to making a software system more observable is to begin with the three pillars of observability: logs, traces, and metrics.
Logs
You’re probably already familiar with logs; logging can be as simple as a print statement or using the Python standard library’s logging package:
import logging

def get_foo():
    logging.info("foo has been gotten")
    return "foo"
Logs are great for debugging specific issues or for being notified when a specific code path is taken, but they aren’t great for forecasting issues with the performance of your system or getting a good idea about its overall health.
Traces
Traces provide context as a request works it through a microservice architecture. They use a randomly generated unique ID to track events from various microservices while maintaining shared context. Traces can be visualized using a flamegraph or icicle chart:
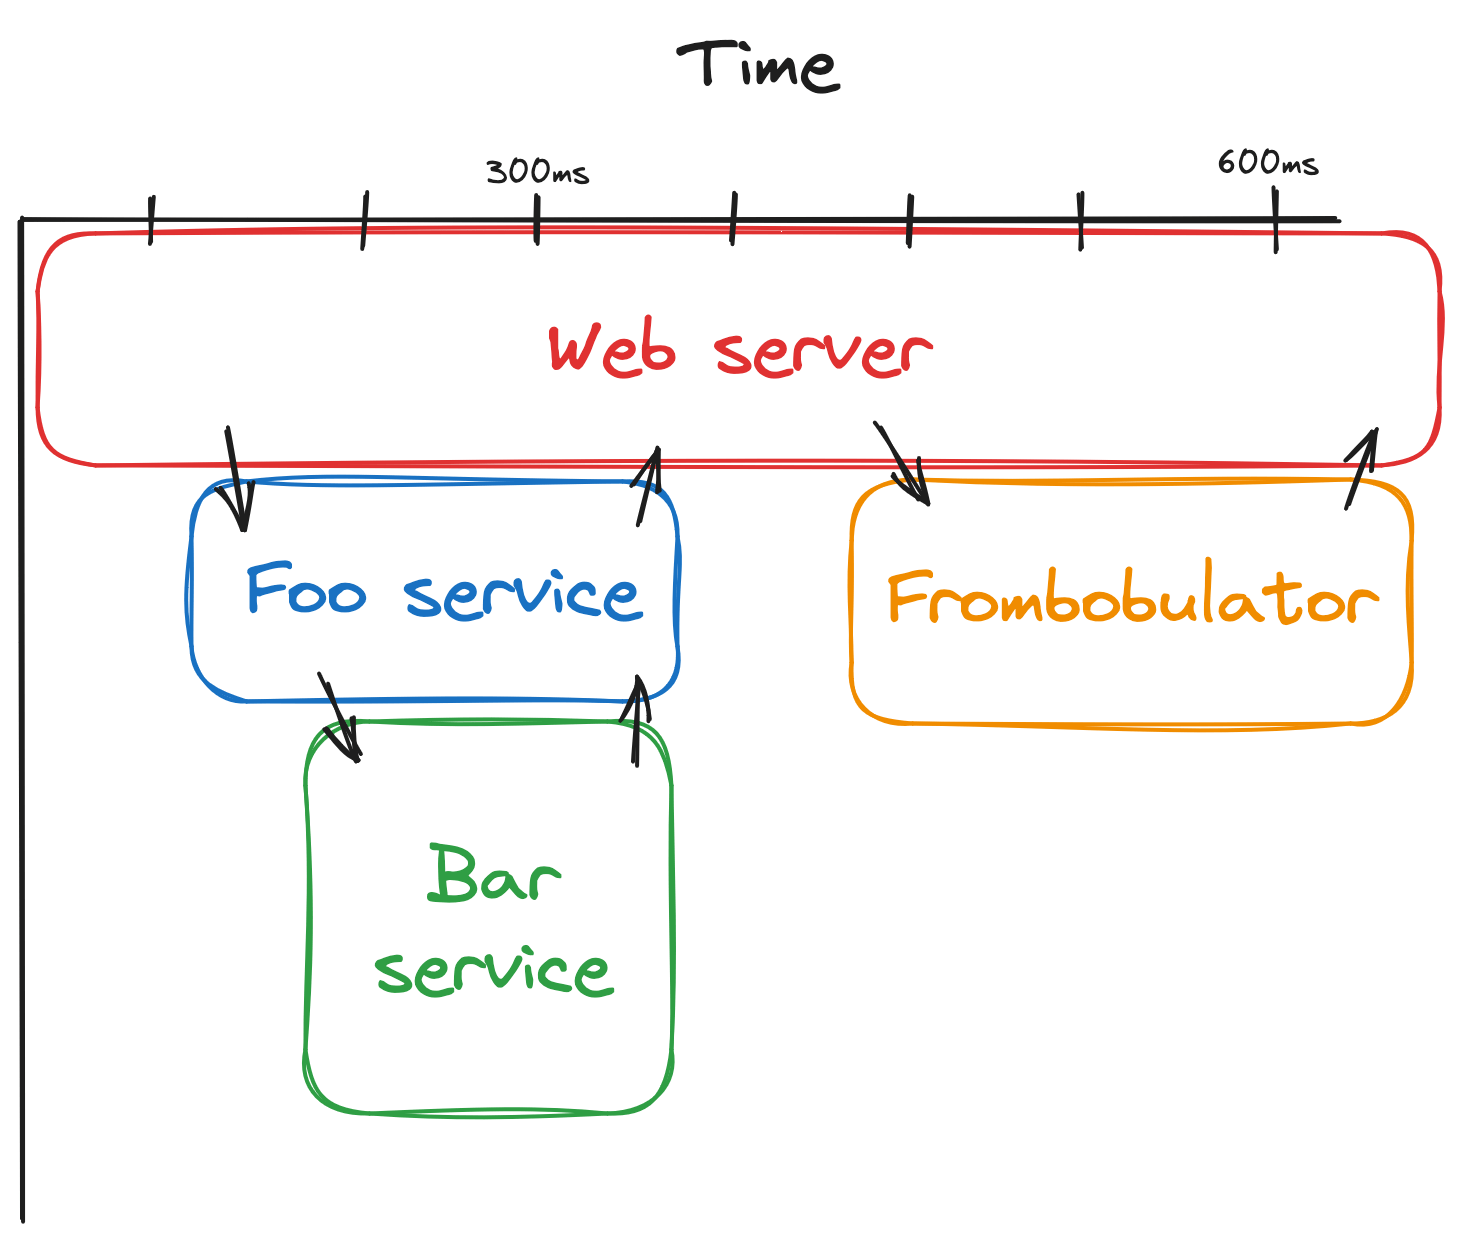
Traces are a must have in a microservice architecture but, like logs, don’t tell the whole story about the health of your system.
Metrics
With metrics, we can measure the performance of the system over varying periods of time. In this article we are going to focus on setting up metrics with a basic Python web server.
The amount of products that deal with metrics is dizzying. A few of the more important ones in this space are:
- OpenTelemetry: a vendor-agnostic standard and ecosystem for handling telemetry (logs, traces, metrics).
- Prometheus: an open source monitoring system and time series database.
- Grafana: an open source analytics and monitoring solution with a focus on charts and alerts.
A typical telemetry setup may look like a web application instrumented to collect metrics. An OTel collector receives telemetry from the web app. The collector is setup to export metrics to Prometheus where they are stored. Grafana can query Prometheus for easily visualizing metrics and setting up alerts.

All major cloud providers also provide their own metrics solution:
Build a basic app using FastAPI
FastAPI is one of the most popular Python web frameworks. It utilizes modern Python features like type hints to provide a world-class developer experience. It is more similar to its older sibling Flask than Django (the two most popular Python web frameworks). We’ll be using it to create a basic web application that can be instrumented.
All code samples can be found on GitHub at joeriddles/python-otel-demo.
First, let’s create a virtual environment, activate it, and install FastAPI. Note we also need to install an ASGI ("asynchronous server gateway interface"). In this case, we’ll use uvicorn. The following code samples assume you’re using a Linux/Unix environment. If you’re on Windows, I highly recommend using WSL2 for Python development.
$ python3 -m venv .venv
$ source .venv/bin/activate
$ pip install fastapi==0.105.0 uvicorn==0.24.0
Next, let’s write a basic app in your code editor of choice. I prefer VS Code for Python.
import random
from fastapi import FastAPI
from fastapi.responses import HTMLResponse
app = FastAPI()
@app.get("/{name}/")
def get_naughty_or_nice(name: str):
naughty_or_nice = "naughty" if bool(random.randint(0, 1)) else "nice"
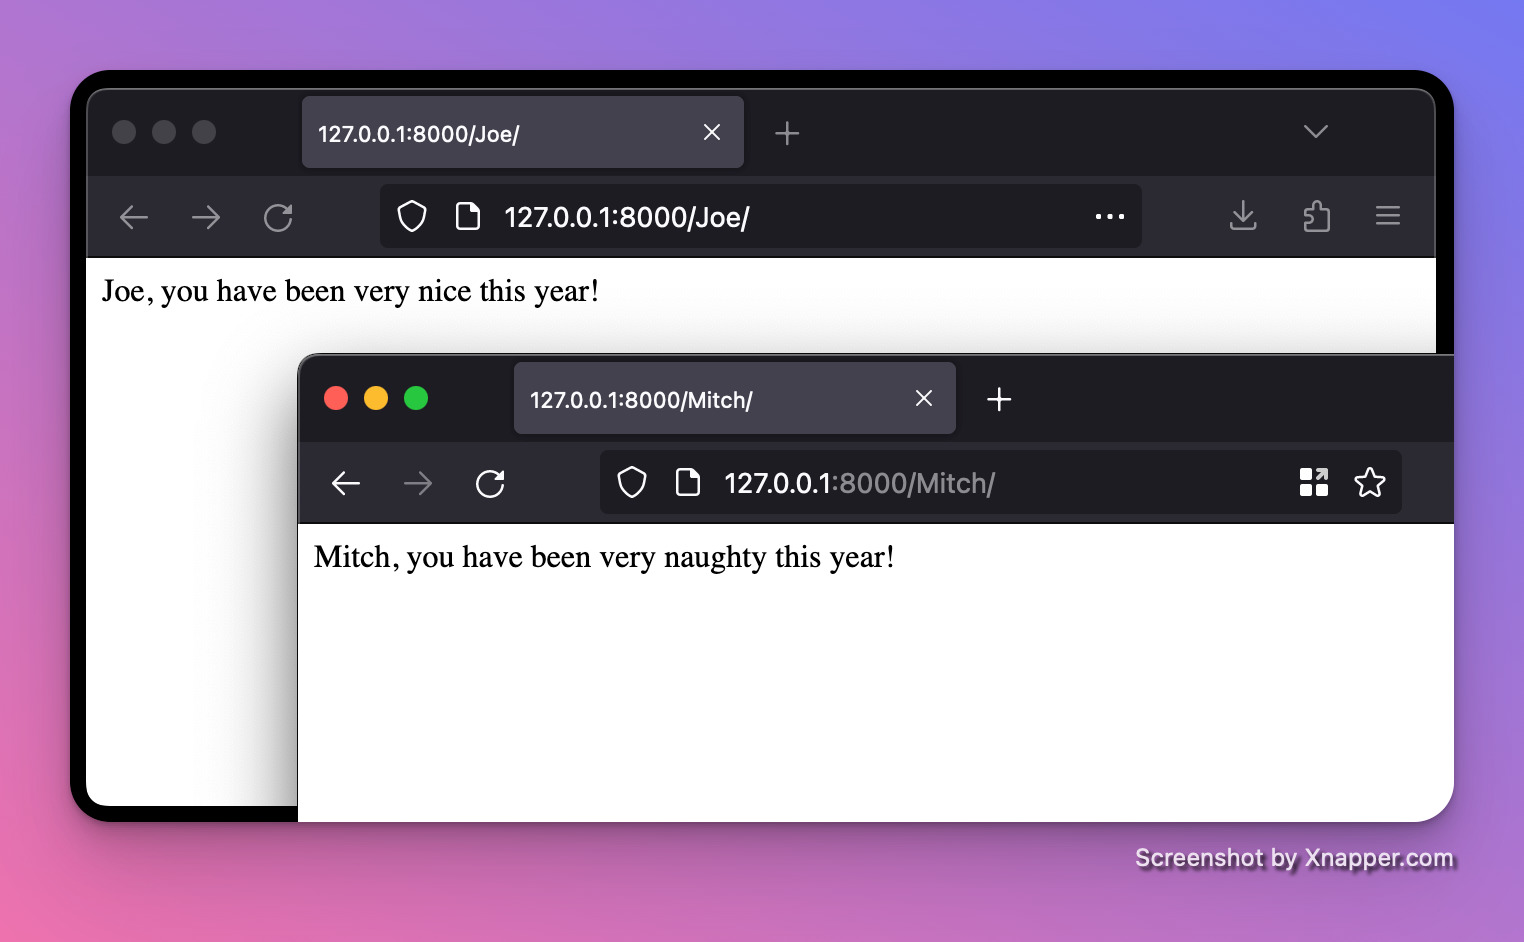
return HTMLResponse(f"{name}, you have been very {naughty_or_nice} this year!")To start the web server, open a terminal and run uvicorn.
$ uvicorn main:app
INFO:     Started server process [14528]
INFO:     Waiting for application startup.
INFO:     Application startup complete.
INFO:     Uvicorn running on http://127.0.0.1:8000 (Press CTRL+C to quit)
After opening up the local web server in our browser, we should see that sometimes we’ve been nice and sometimes we’ve been naughty (cough Mitch).
Automatic instrumentation
Now that we have a basic app, let’s set about getting our first metrics. The easiest way to add metrics when you are starting from scratch is to using automatic instrumentation.
Fortunately, OpenTelemetry provides a distro for bootstrapping automatic instrumentation. The distro analyzes our code to determine what packages we’re using and automatically hooks in at runtime. Let’s install it.
$ pip install opentelemetry-distro==0.42b0 opentelemetry-instrumentation-fastapi==0.42b0
$ export OTEL_PYTHON_LOGGING_AUTO_INSTRUMENTATION_ENABLED=true
$ opentelemetry-instrument
  --traces_exporter none
  --metrics_exporter console
  --metric_export_interval 5000
  --service_name main
  uvicorn main:app
The opentelemetry-instrument command injects bytecode for instrumentation and then runs the program (uvicorn main:app). Our options to the command include:
--traces_exporter none: disables exporting traces because we’re focused on metrics--metrics_exporter console: prints the metrics info to the console--metric_export_interval 5000: print the metrics every 5,000 ms (5 seconds).
Note the docs recommend using
opentelemetry-bootstrap -a install, but in my experience this installs a lot of unnecessary packages.
After refreshing our web page in the browser a few times, we should start seeing metrics reported in the console:
{
    "resource_metrics": [
        {
            "resource": {
                "attributes": {
                    "telemetry.sdk.language": "python",
                    "telemetry.sdk.name": "opentelemetry",
                    "telemetry.sdk.version": "1.21.0",
                    "service.name": "main",
                    "telemetry.auto.version": "0.42b0"
                },
                "schema_url": ""
            },
            "scope_metrics": [
                {
                    "scope": {
                        "name": "opentelemetry.instrumentation.fastapi",
                        "version": "0.42b0",
                        "schema_url": "https://opentelemetry.io/schemas/1.11.0"
                    },
                    "metrics": [
                        {
                            "name": "http.server.active_requests",
                            "description": "measures the number of concurrent HTTP requests that are currently in-flight",
                            "unit": "requests",
                            "data": {
                                "data_points": [
                                    {
                                        "attributes": {
                                            "http.host": "127.0.0.1:8000",
                                            "http.flavor": "1.1",
                                            "http.method": "GET",
                                            "http.scheme": "http",
                                            "http.server_name": "127.0.0.1:8000"
                                        },
                                        "start_time_unix_nano": 1702933388063895000,
                                        "time_unix_nano": 1702933394704893000,
                                        "value": 0
                                    }
                                ],
                                "aggregation_temporality": 2,
                                "is_monotonic": false
                            }
                        },
                        ...
                    ],
                    "schema_url": "https://opentelemetry.io/schemas/1.11.0"
                }
            ],
            "schema_url": ""
        }
    ]
}
OpenTelemetry collector
Right now we're just dumping our metrics to the console, but we really want to export it to an OTel collector. OTel collectors receive telemetry data, process it, and then export it to OTel various backends.
It's possible to get by without a collector (as we'll see later), but generally not recommended. The main benefit of skipping a collector is a simpler setup, but it tightly couples your application to the OTel backend. Collectors are often ran as sidecar processes in Kubernetes pods.
Let’s spin up a local collector. We'll use Docker containers to easily start the collector and other services that depend on it. First, let’s define a Docker Compose config:
# docker-compose.yml
services:
  collector:
    image: otel/opentelemetry-collector-contrib:0.91.0
    command: ["--config=/etc/otel-collector-config.yml"]
    volumes:
      - "./otel-collector-config.yml:/etc/otel-collector-config.yml"
    ports:
      - "4317:4317"   # OTLP over gRPC
      - "4318:4318"   # OTLP over HTTP
      - "55679:55679" # zPages
      - "13133:13133" # health check
    healthcheck:
      test: ["CMD", "curl", "--fail", "localhost:13133"]
      interval: 10s
      timeout: 1s
      retries: 5
      start_period: 10s
We're mounting a local otel-collector-config.yml file, so we'll need to create that as well:
# otel-collector-config.yml
receivers:
  otlp:
    protocols:
      http:
        cors:
          allowed_origins:
            - "*"

processors:
  batch:

exporters:
  debug:
    verbosity: detailed

extensions:
  health_check:
  zpages:

service:
  extensions: [health_check, zpages]
  pipelines:
    metrics:
      receivers: [otlp]
      processors: [batch]
      exporters: [debug]
We've configured our collector to:
- receive data via the OpenTelemetry Protocol protocol using HTTP (not gRPC)
- process the incoming metrics in batches
- export the processed metrics to the console
We've also enabled two extensions. zPages provides a web server for debugging the collector and its components. Some of the available zPages URLs include http://localhost:55679/debug/servicez and http://localhost:55679/debug/tracez. Health Check adds an HTTP endpoint that can be used for checking liveness of the collector. We're using it in our Docker Compose config to monitor the container. Other collector config options can be found here: https://opentelemetry.io/docs/collector/configuration/.
Start the container:
$ docker compose upIn another terminal we'll launch our web server. This time it will export to the OTel collector instead of printing straight to the console:
$ export OTEL_PYTHON_LOGGING_AUTO_INSTRUMENTATION_ENABLED=true
$ opentelemetry-instrument
  --traces_exporter none
  --metrics_exporter otlp
  --metric_export_interval 5000
  --exporter_otlp_protocol 'http/protobuf'
  --exporter_otlp_endpoint 'http://localhost:4318'
  --service_name main
  uvicorn main:app
Refresh your web page a few times and we should see some logs from the collector container:
...
otel-demo-collector-1  | Metric #0
otel-demo-collector-1  | Descriptor:
otel-demo-collector-1  |      -> Name: http.server.active_requests
otel-demo-collector-1  |      -> Description: measures the number of concurrent HTTP requests that are currently in-flight
otel-demo-collector-1  |      -> Unit: requests
otel-demo-collector-1  |      -> DataType: Sum
otel-demo-collector-1  |      -> IsMonotonic: false
otel-demo-collector-1  |      -> AggregationTemporality: Cumulative
otel-demo-collector-1  | NumberDataPoints #0
otel-demo-collector-1  | Data point attributes:
otel-demo-collector-1  |      -> http.server_name: Str(127.0.0.1:8000)
otel-demo-collector-1  |      -> http.method: Str(GET)
otel-demo-collector-1  |      -> http.flavor: Str(1.1)
otel-demo-collector-1  |      -> http.host: Str(127.0.0.1:8000)
otel-demo-collector-1  |      -> http.scheme: Str(http)
otel-demo-collector-1  | StartTimestamp: 2023-12-18 21:32:23.385188 +0000 UTC
otel-demo-collector-1  | Timestamp: 2023-12-18 21:32:23.950872 +0000 UTC
otel-demo-collector-1  | Value: 0
otel-demo-collector-1  | Metric #1
otel-demo-collector-1  | Descriptor:
otel-demo-collector-1  |      -> Name: http.server.duration
otel-demo-collector-1  |      -> Description: measures the duration of the inbound HTTP request
otel-demo-collector-1  |      -> Unit: ms
otel-demo-collector-1  |      -> DataType: Histogram
otel-demo-collector-1  |      -> AggregationTemporality: Cumulative
otel-demo-collector-1  | HistogramDataPoints #0
otel-demo-collector-1  | Data point attributes:
otel-demo-collector-1  |      -> net.host.port: Int(8000)
otel-demo-collector-1  |      -> http.server_name: Str(127.0.0.1:8000)
otel-demo-collector-1  |      -> http.method: Str(GET)
otel-demo-collector-1  |      -> http.flavor: Str(1.1)
otel-demo-collector-1  |      -> http.host: Str(127.0.0.1:8000)
otel-demo-collector-1  |      -> http.scheme: Str(http)
otel-demo-collector-1  |      -> http.status_code: Int(200)
otel-demo-collector-1  |      -> http.target: Str(/{name}/)
otel-demo-collector-1  | StartTimestamp: 2023-12-18 21:32:23.391557 +0000 UTC
otel-demo-collector-1  | Timestamp: 2023-12-18 21:32:23.950872 +0000 UTC
otel-demo-collector-1  | Count: 2
otel-demo-collector-1  | Sum: 12.000000
otel-demo-collector-1  | Min: 1.000000
otel-demo-collector-1  | Max: 11.000000
otel-demo-collector-1  | ExplicitBounds #0: 0.000000
...
otel-demo-collector-1  | ExplicitBounds #14: 10000.000000
otel-demo-collector-1  | Buckets #0, Count: 0
...
Azure Monitor Application Insights
Sending our metric logs to the console isn't going to help us detect and prevent outages. Obviously we'll need to send them to some service where we can view graphs of metric data and configure alerts for activity that may cause our system to fail.
We'll use Azure Monitor Application Insights. Azure has been adding support for OpenTelemetry as OTel becomes more and more popular in the industry. It also aligns with Microsoft's strategy to embrace open source software.
At the time of this writing, Azure does not officially support using the OpenTelemetry collector to send telemetry. There is an unofficial, community-created OTel exporter for Azure, but for the purposes of this article, we'll use the officially supported solution. With that being said, you can stop your local OTel collector.
$ docker compose downLet’s create a resource group in Azure. I'll use the web UI, but you could also use the CLI or even terraform.
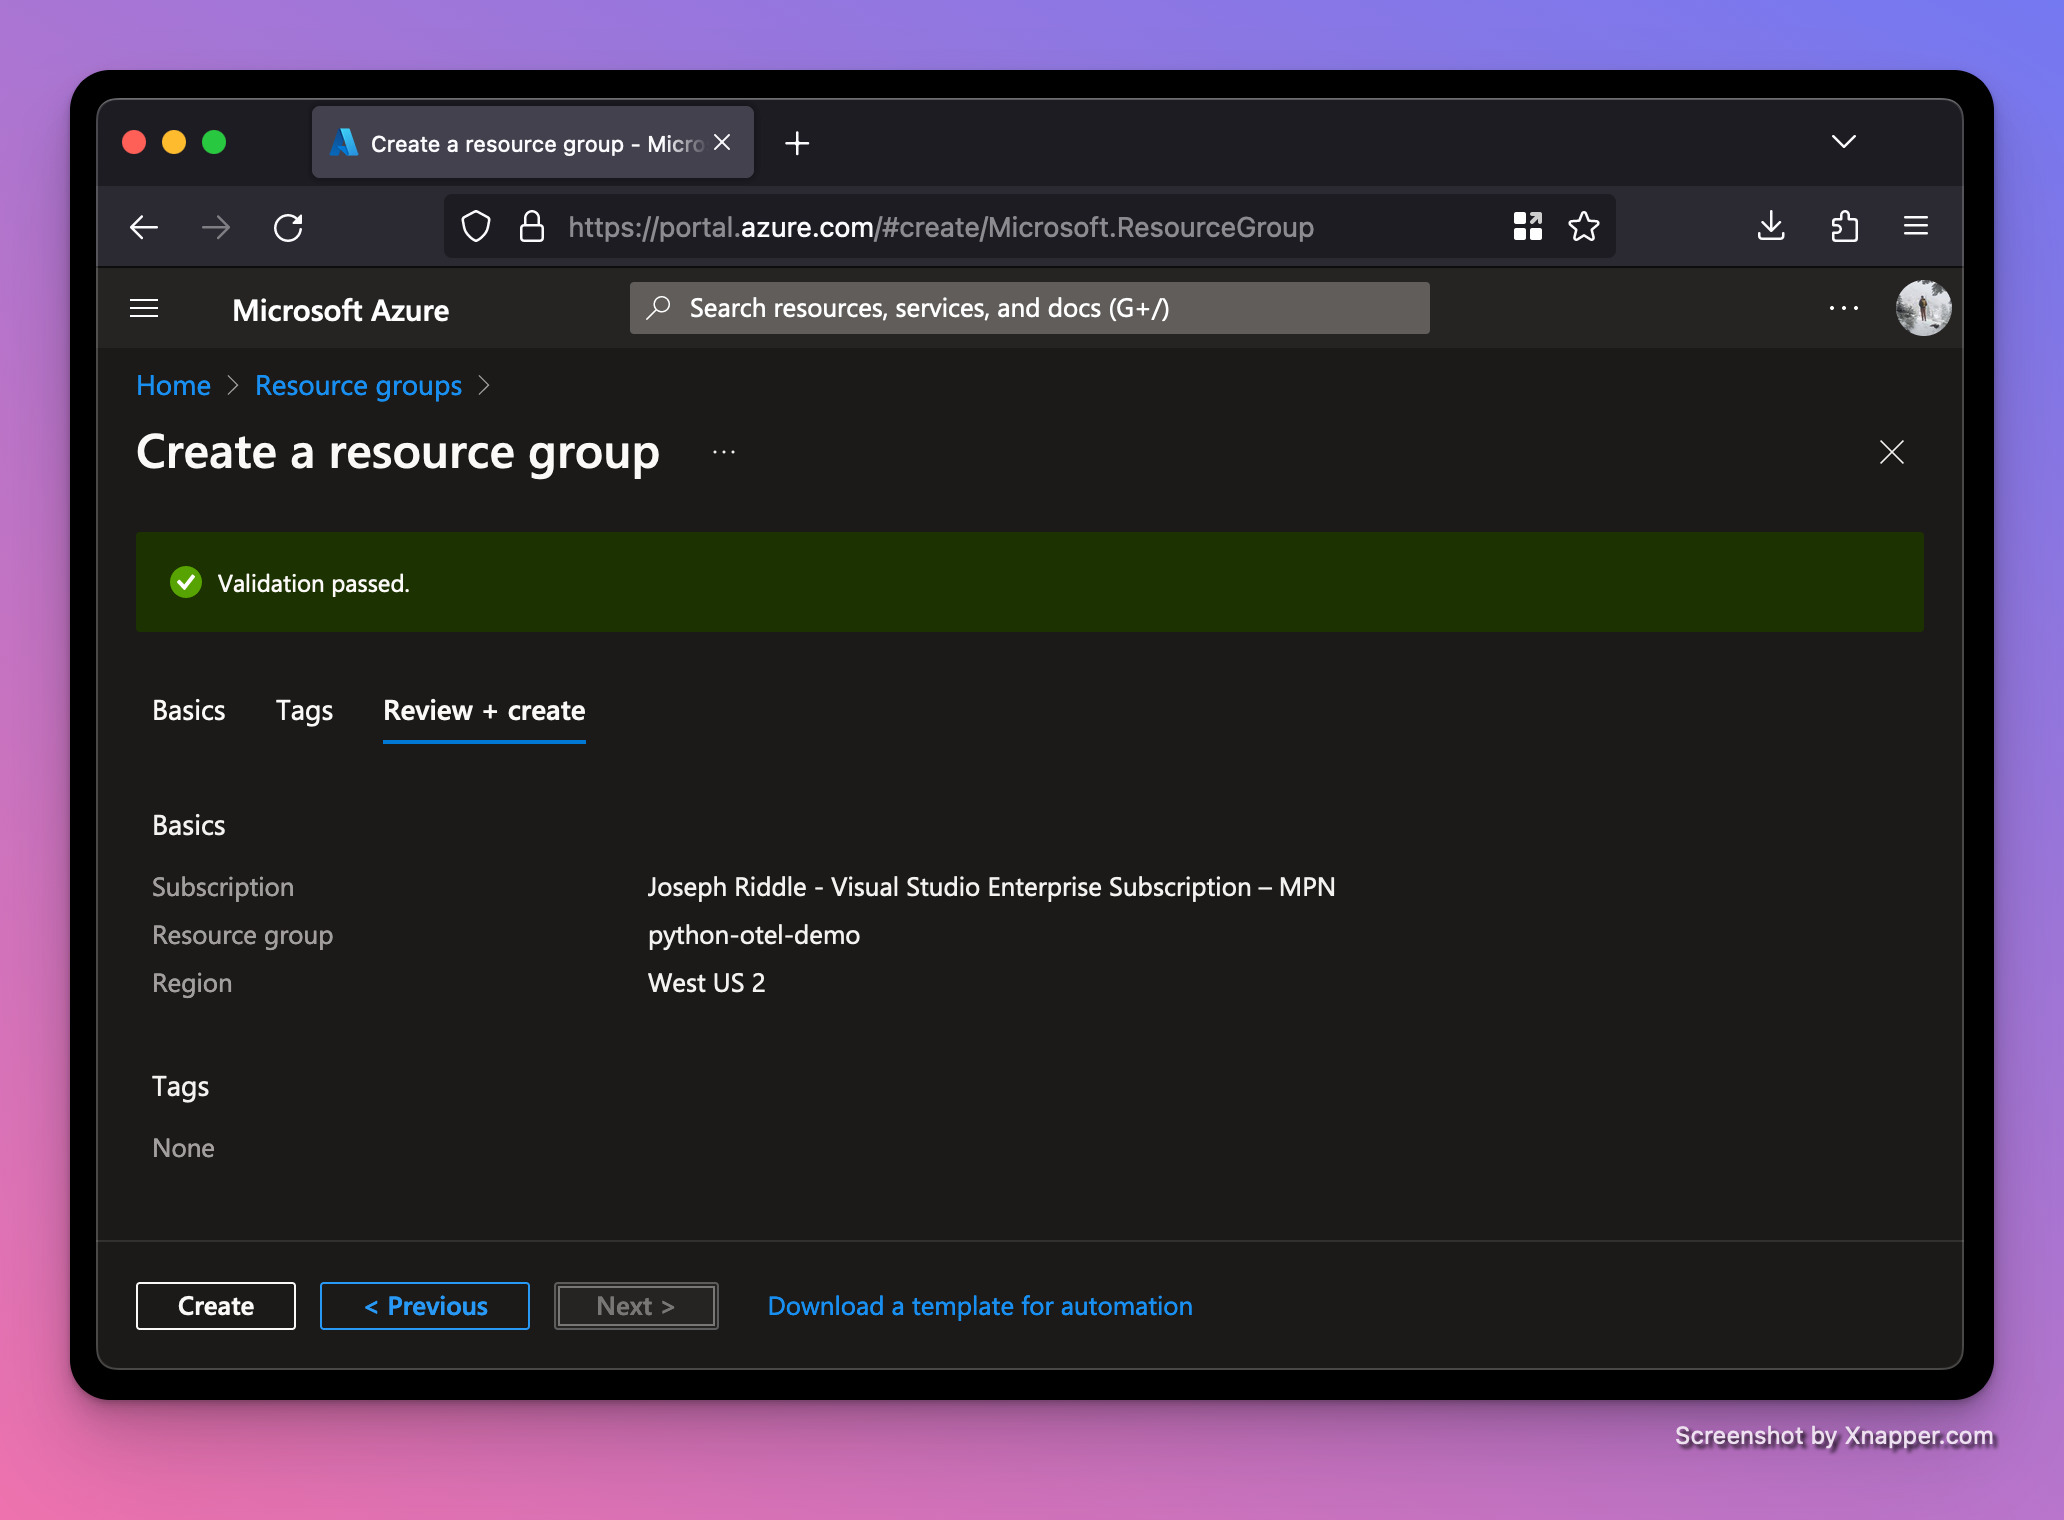
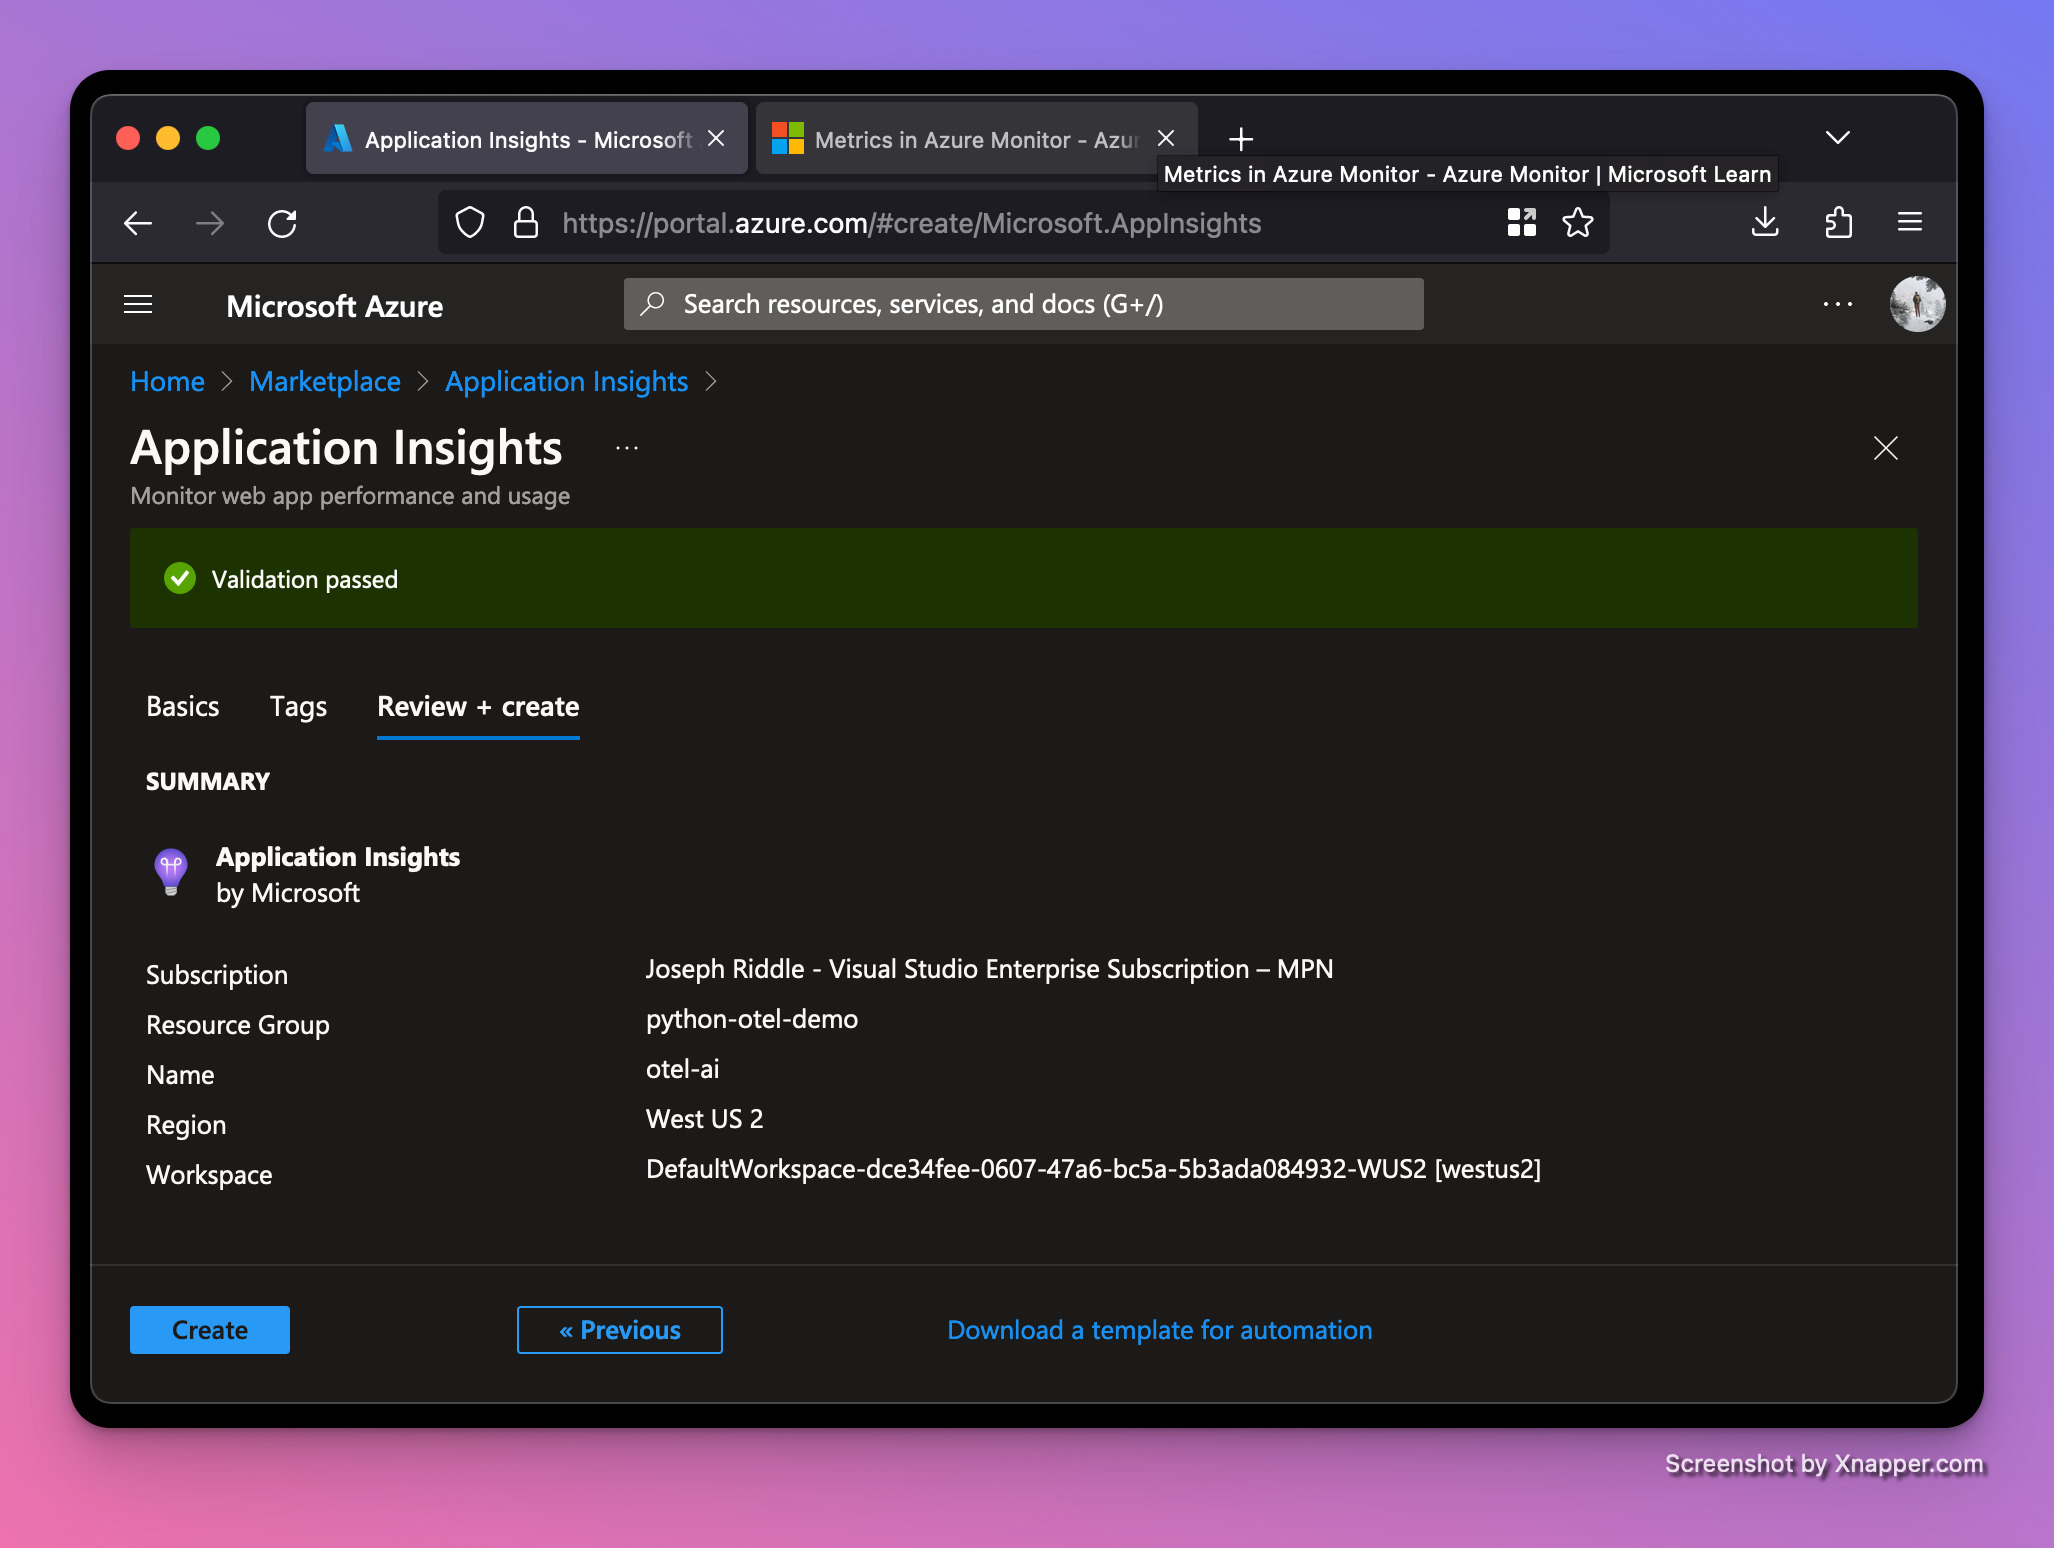
After creating the resource group, we're ready to create an Application Insights resource in the resource group.
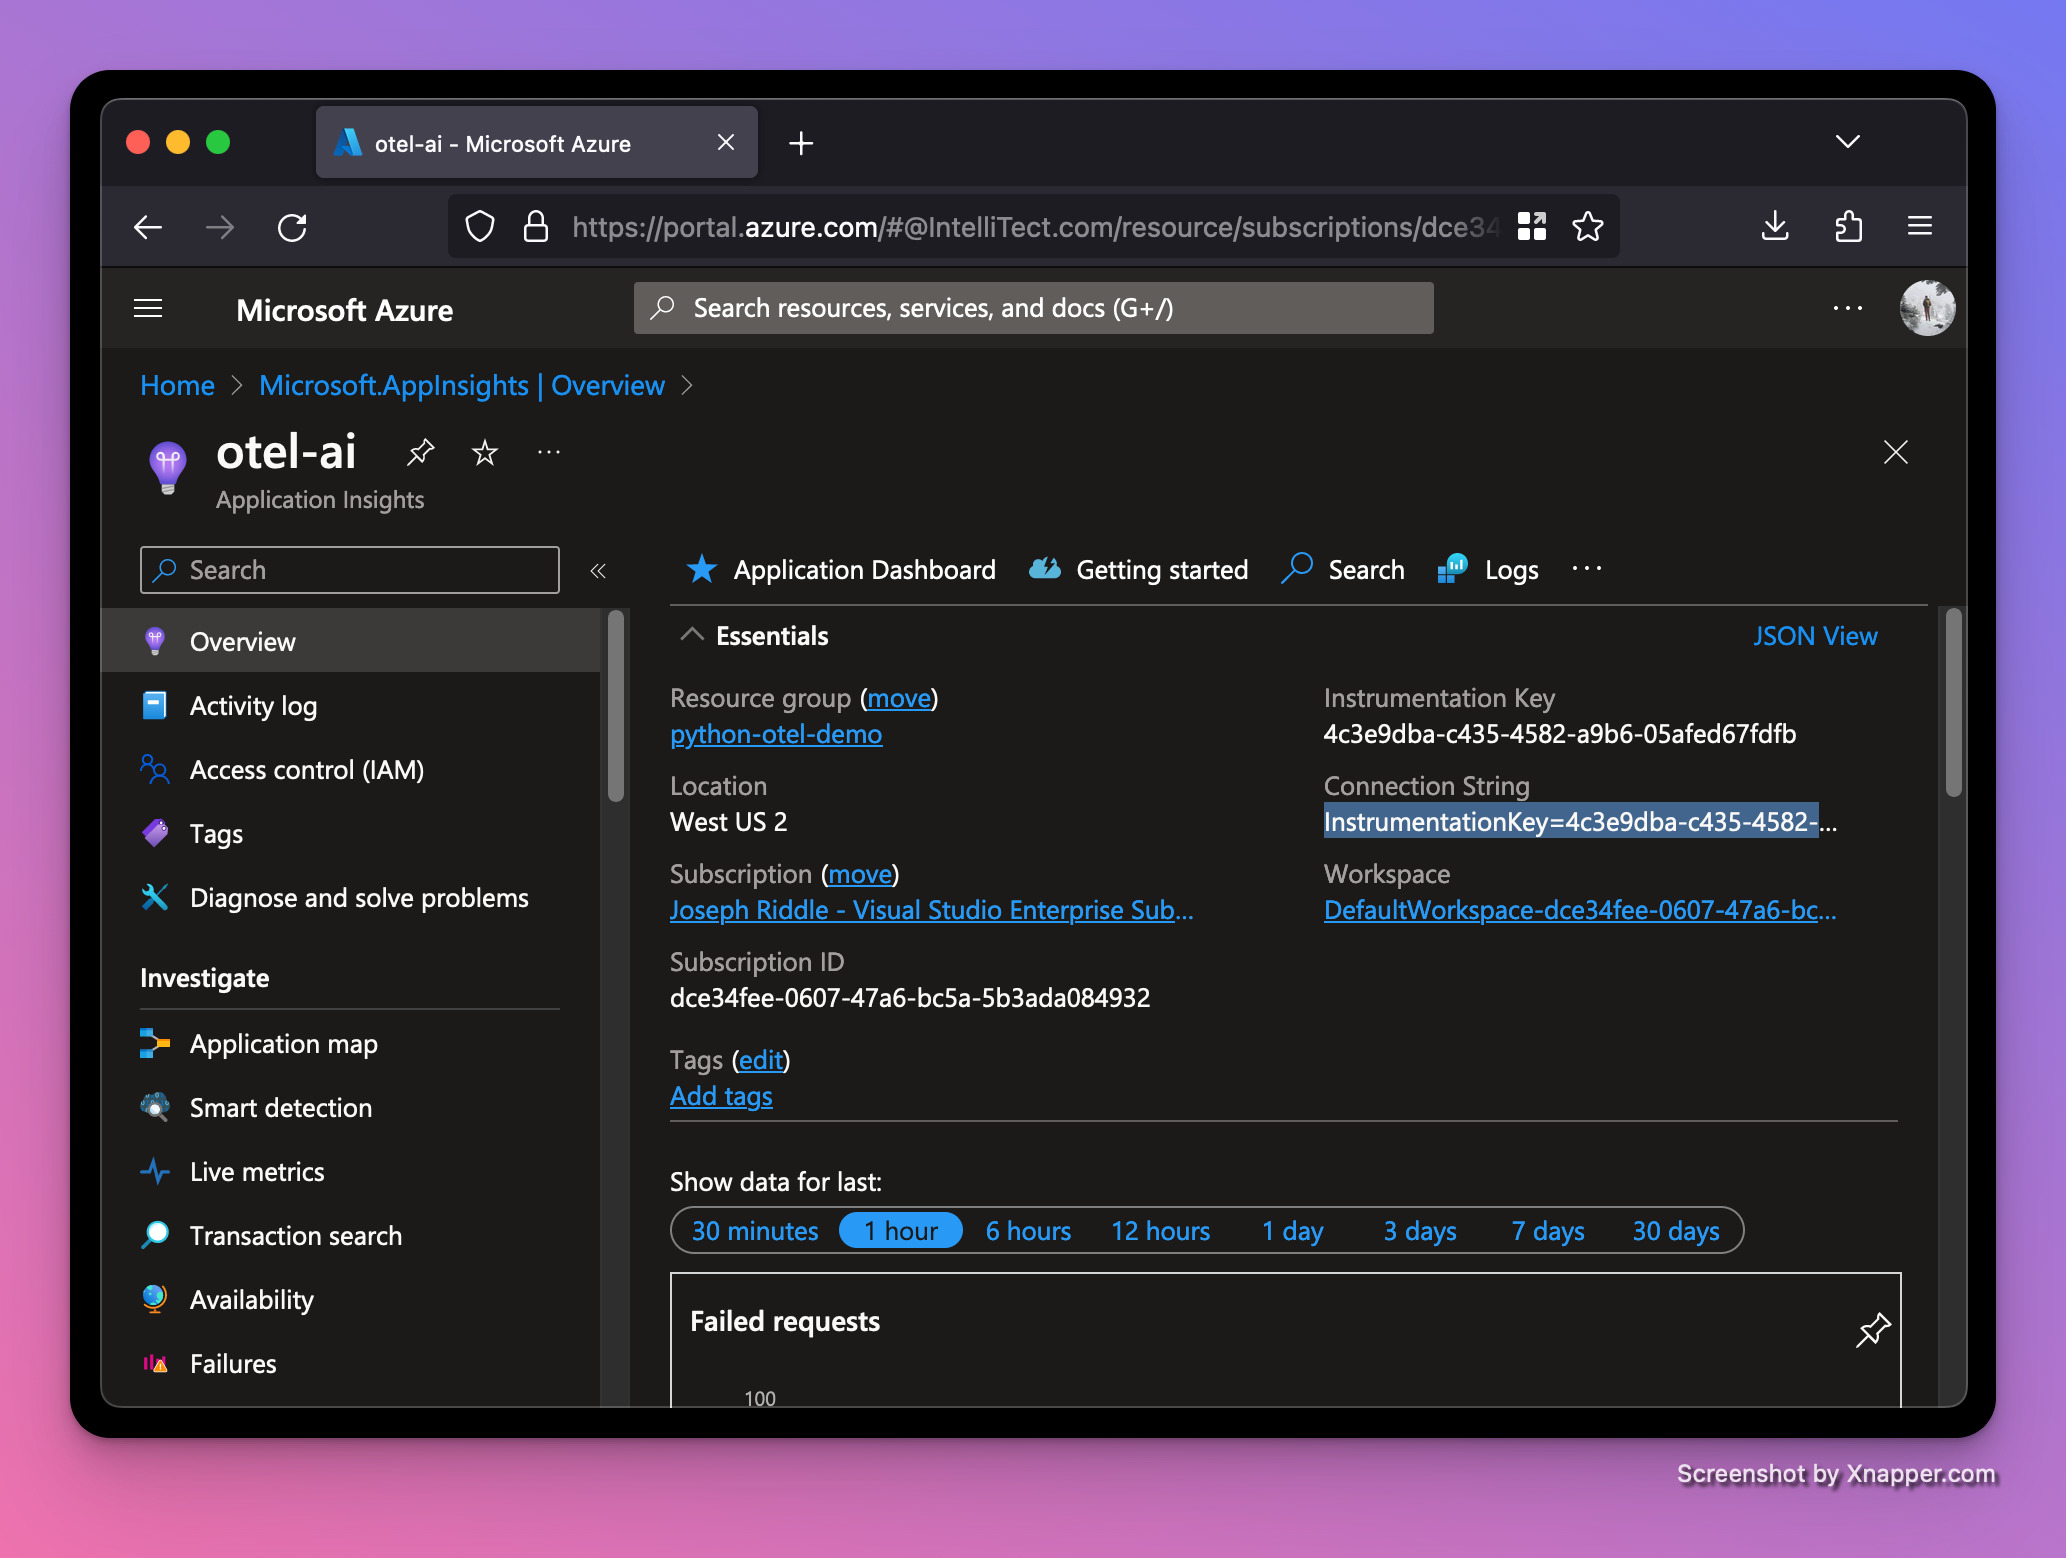
Once the Application Insights resource is done being created, we can grab the Connection String from its dashboard. We'll need this Connection String to connect our local Python web server to Azure.
There's a myriad of ways to set environment variables for a Python script. My favorite way is using a tool named direnv. If a folder contains an .envrc file, direnv automatically loads and exports environment variables when navigating to that folder. Let’s set it up. Replace <YOUR_CONNECTION_STRING> with the real value from your Azure resource.
$ APPLICATIONINSIGHTS_CONNECTION_STRING='<YOUR_CONNECTION_STRING>'
$ echo 'dotenv' > .envrc
$ echo "APPLICATIONINSIGHTS_CONNECTION_STRING='$APPLICATIONINSIGHTS_CONNECTION_STRING'" > .env
$ direnv allow
The reason we put the APPLICATIONINSIGHTS_CONNECTION_STRING value into .env instead of .envrc is so we can check .envrc into source control, but leave .env gitignored. We also need to run direnv allow to mark this folder as safe for direnv to run in (by default it won't try to load unless you allow it).
Now we're ready to add code to our Python module to report metrics to Azure. Azure has its own OpenTelemetry distro for Python, so let’s install it.
$ pip install azure-monitor-opentelemetry==1.1.1Now update your main.py module to match below.
# main.py
import functools
import os
import random
import time
import typing

from azure.monitor.opentelemetry import configure_azure_monitor
from fastapi import FastAPI
from fastapi.responses import HTMLResponse
from opentelemetry import metrics

# See https://github.com/Azure/azure-sdk-for-python/issues/33301
os.environ["OTEL_EXPERIMENTAL_RESOURCE_DETECTORS"] = "azure_app_service"

# loads from APPLICATIONINSIGHTS_CONNECTION_STRING environment variable
configure_azure_monitor(disable_logging=True, disable_tracing=True)

app = FastAPI()

meter = metrics.get_meter("main")
counter = meter.create_counter("request-count")
histogram = meter.create_histogram("request-latency")

def record_latency(func: typing.Callable) -> typing.Callable:
    """Record how long `func` takes to execute and report its latency."""

    @functools.wraps(func)
    def wrapper(*args, **kwargs):
        start = time.time()
        try:
            result = func(*args, **kwargs)
            duration_ms = (time.time() - start) * 1_000
            histogram.record(duration_ms, kwargs)
            return result
        except Exception as err:
            duration_ms = (time.time() - start) * 1_000
            kwargs["error"] = str(err)
            histogram.record(duration_ms, kwargs)
            raise err

    return wrapper

@app.get("/{name}/")
@record_latency
def get_naughty_or_nice(name: str):
    counter.add(1, {"name": name})
    naughty_or_nice = "naughty" if bool(random.randint(0, 1)) else "nice"
    return HTMLResponse(f"{name}, you have been very {naughty_or_nice} this year!")
Key code changes include:
configure_azure_monitor(...): to configure our connection to Azure. It attempts to load theAPPLICATIONINSIGHTS_CONNECTION_STRINGenvironment variable by default.meter = metrics.get_meter("main"): this creates an OpenTelemetry meter, which is used for creating instruments (counters, histograms, and more).counter = meter.create_counter("request-count"): Counters track a value that always increases, like the number of requests.histogram = meter.create_histogram("request-latency"): Histograms aggregate raw data, allowing you to perform statistical samples on the them and answer questions like "how many request response times are within my P95?".counter.add(1, {"name": name}): this increments our counter once and includes an extra attribute for the the name in request URL.histogram.record(duration_ms, kwargs): this records how long it took for our server to generate a response to the request. We've written arecord_latencydecorator to both create reusable latency logic and handle any exceptions that may be raised when creating the response.
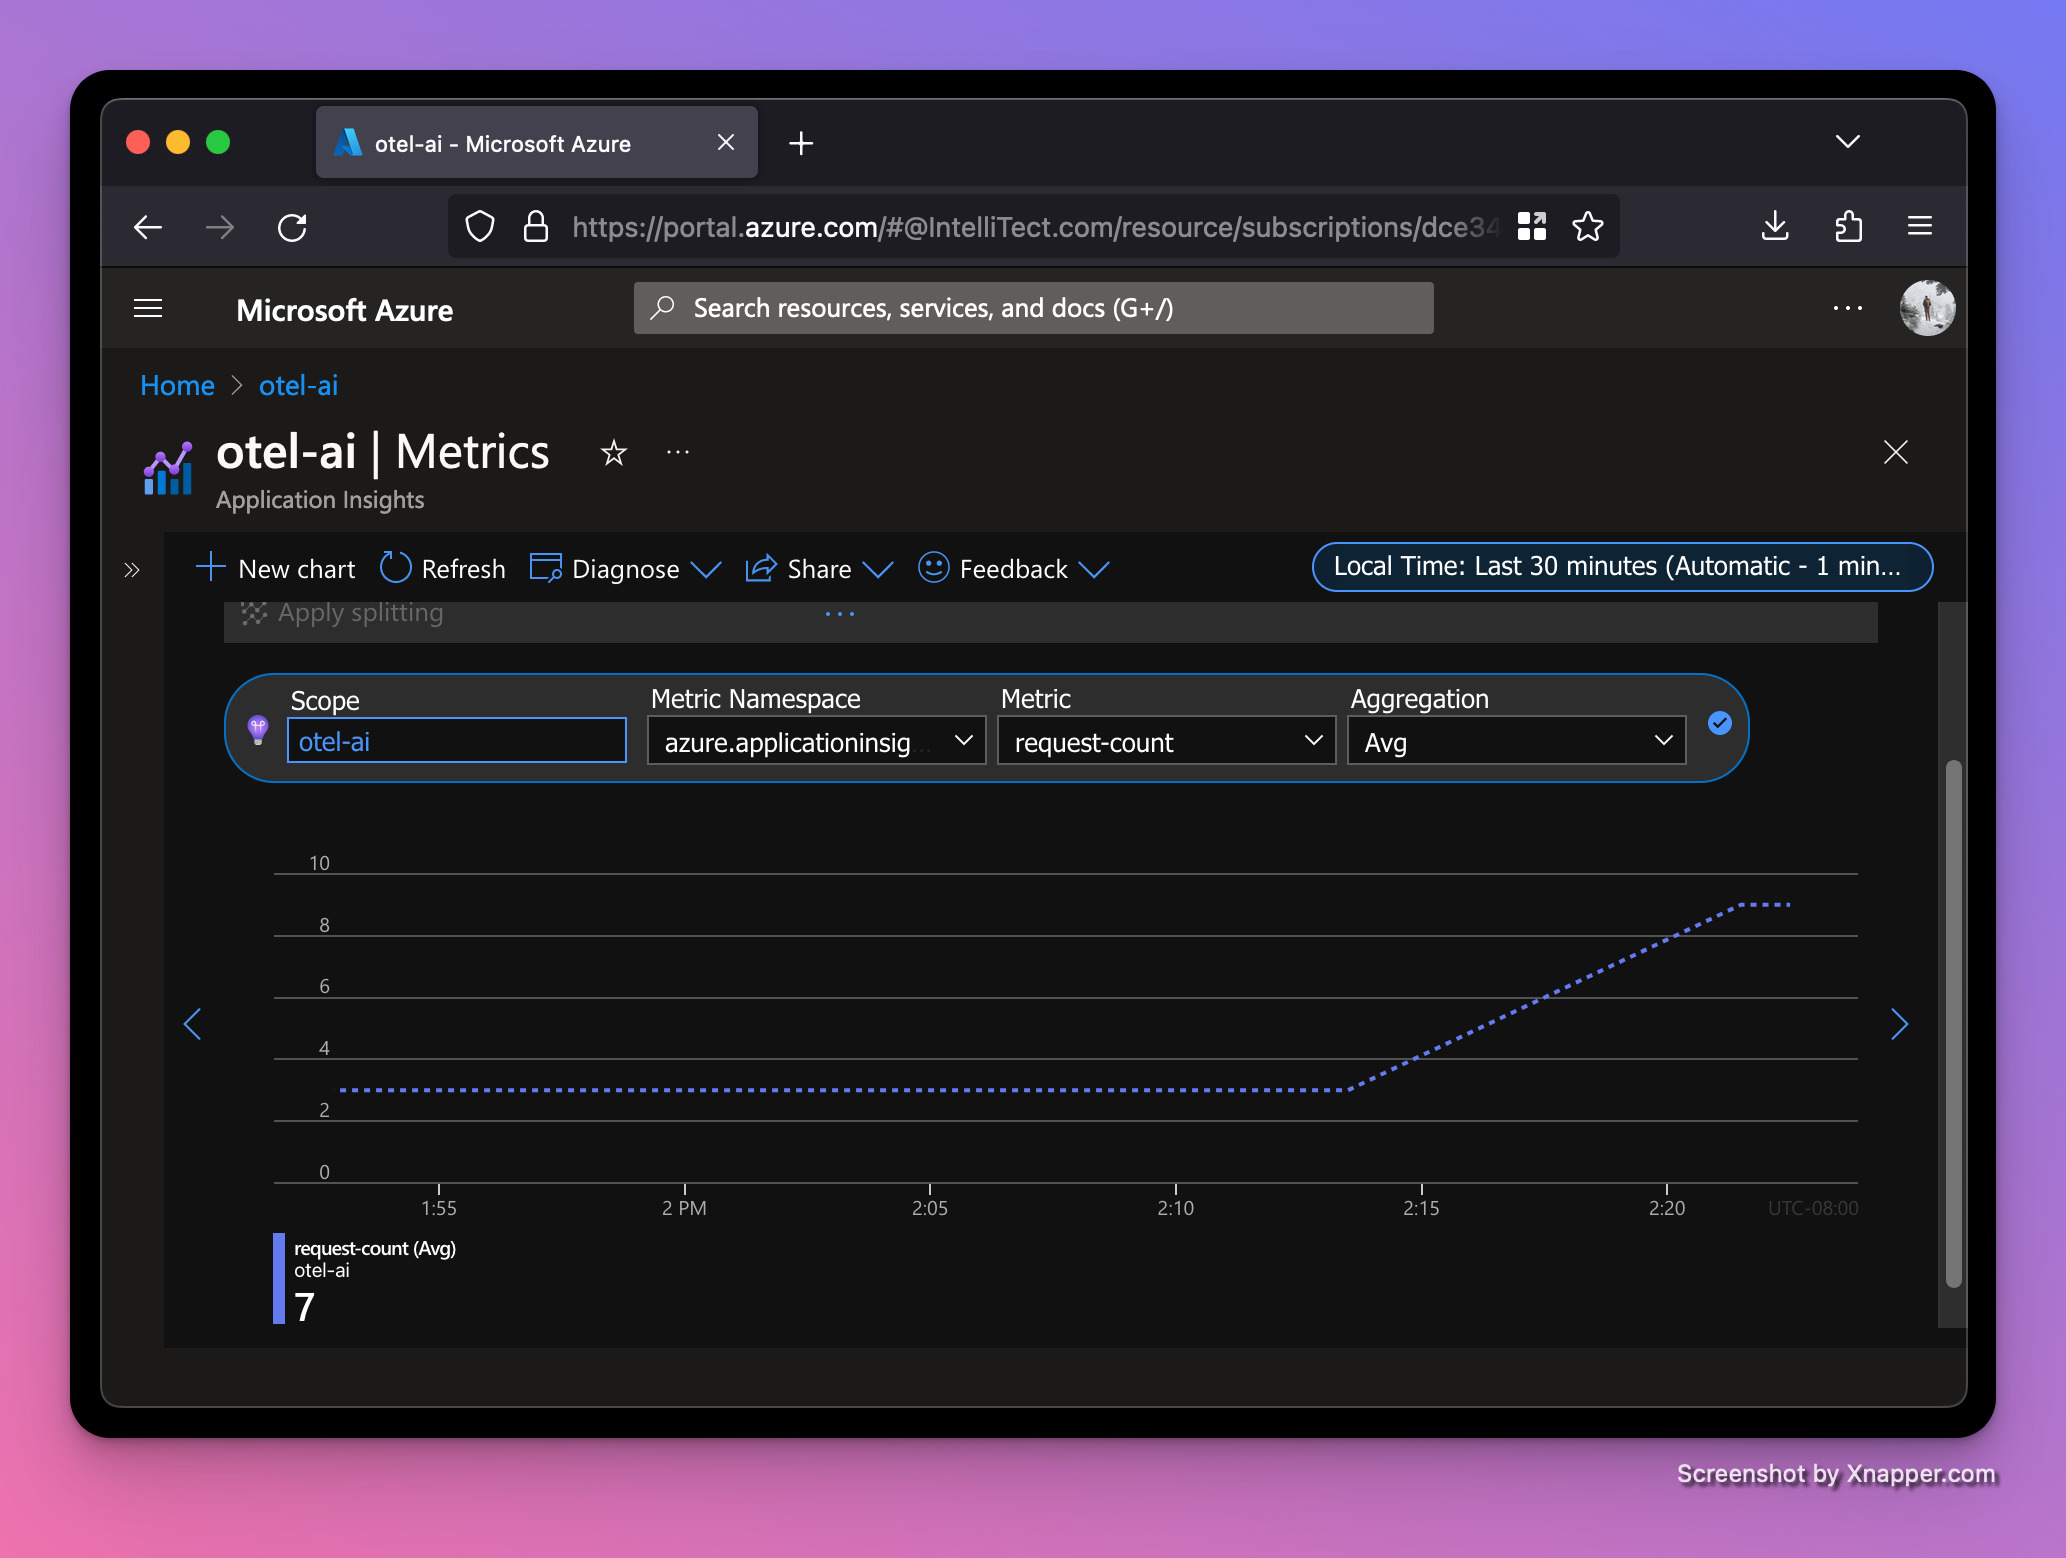
Let’s run our server again and refresh the browser a few times. After a minute, we should see the requests start to appear in the Application Insights resource. To see the charts below, go to your Application Insights resource and click on Metrics underneath the Monitoring section on the left navbar, then change the Metric Namespace dropdown to be azure.applicationinsights. You can play with the Metric and Aggregation dropdowns to see different graphs for our two OTel instruments.
Average request-count
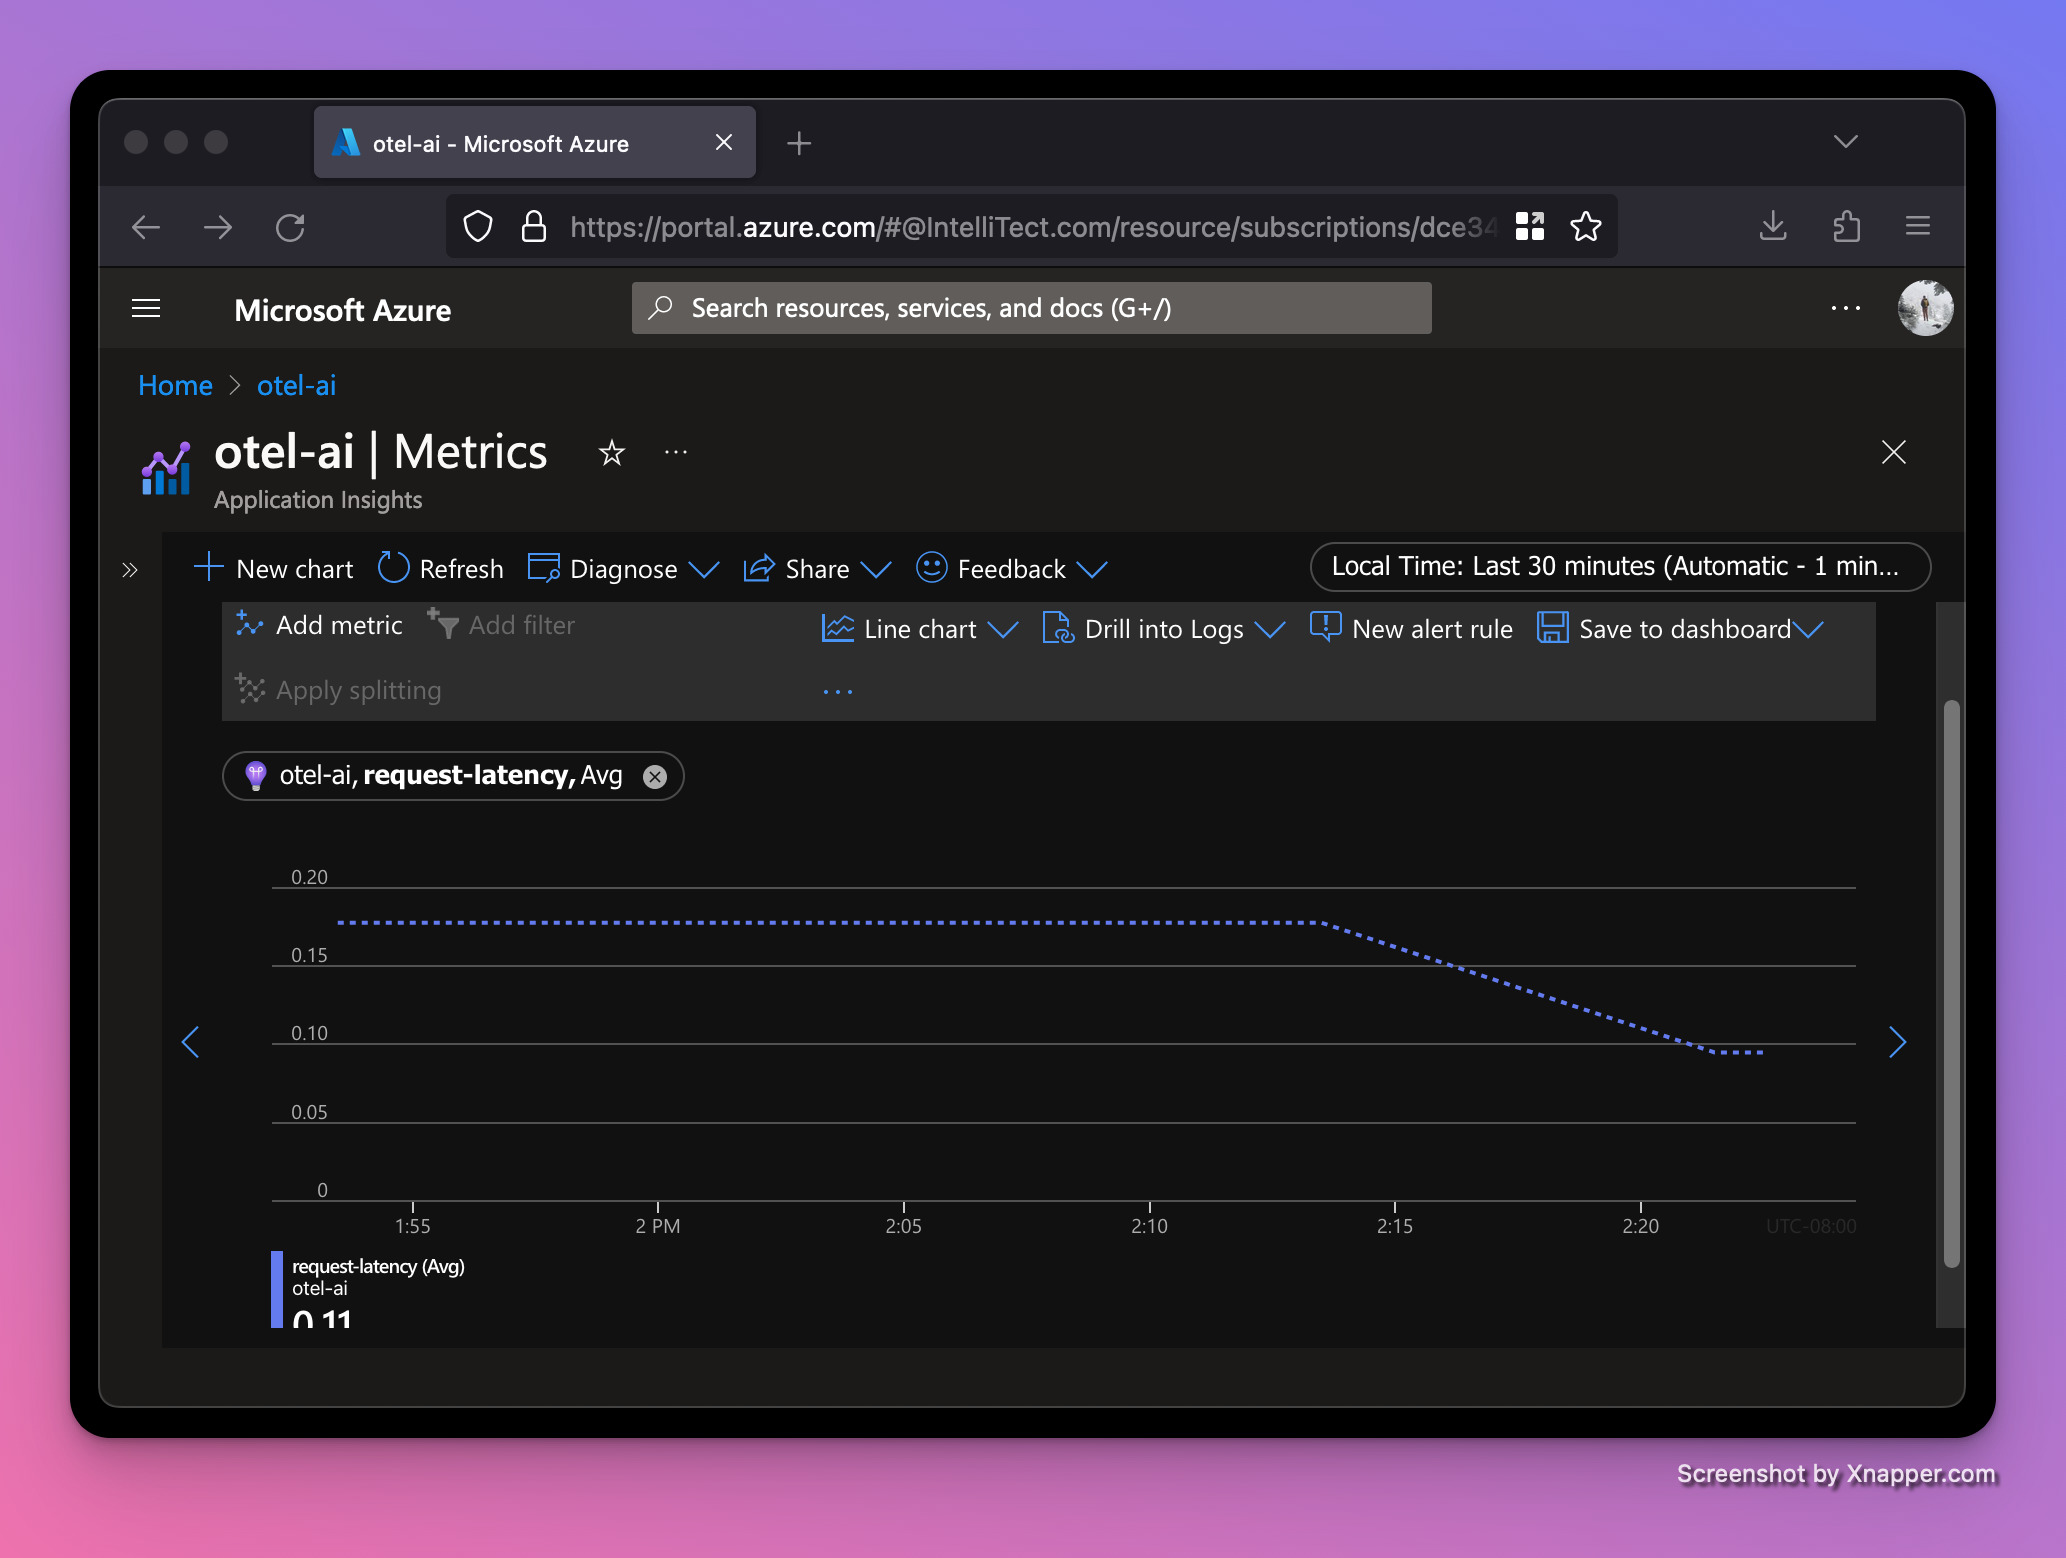
Average request-latency (in milliseconds)
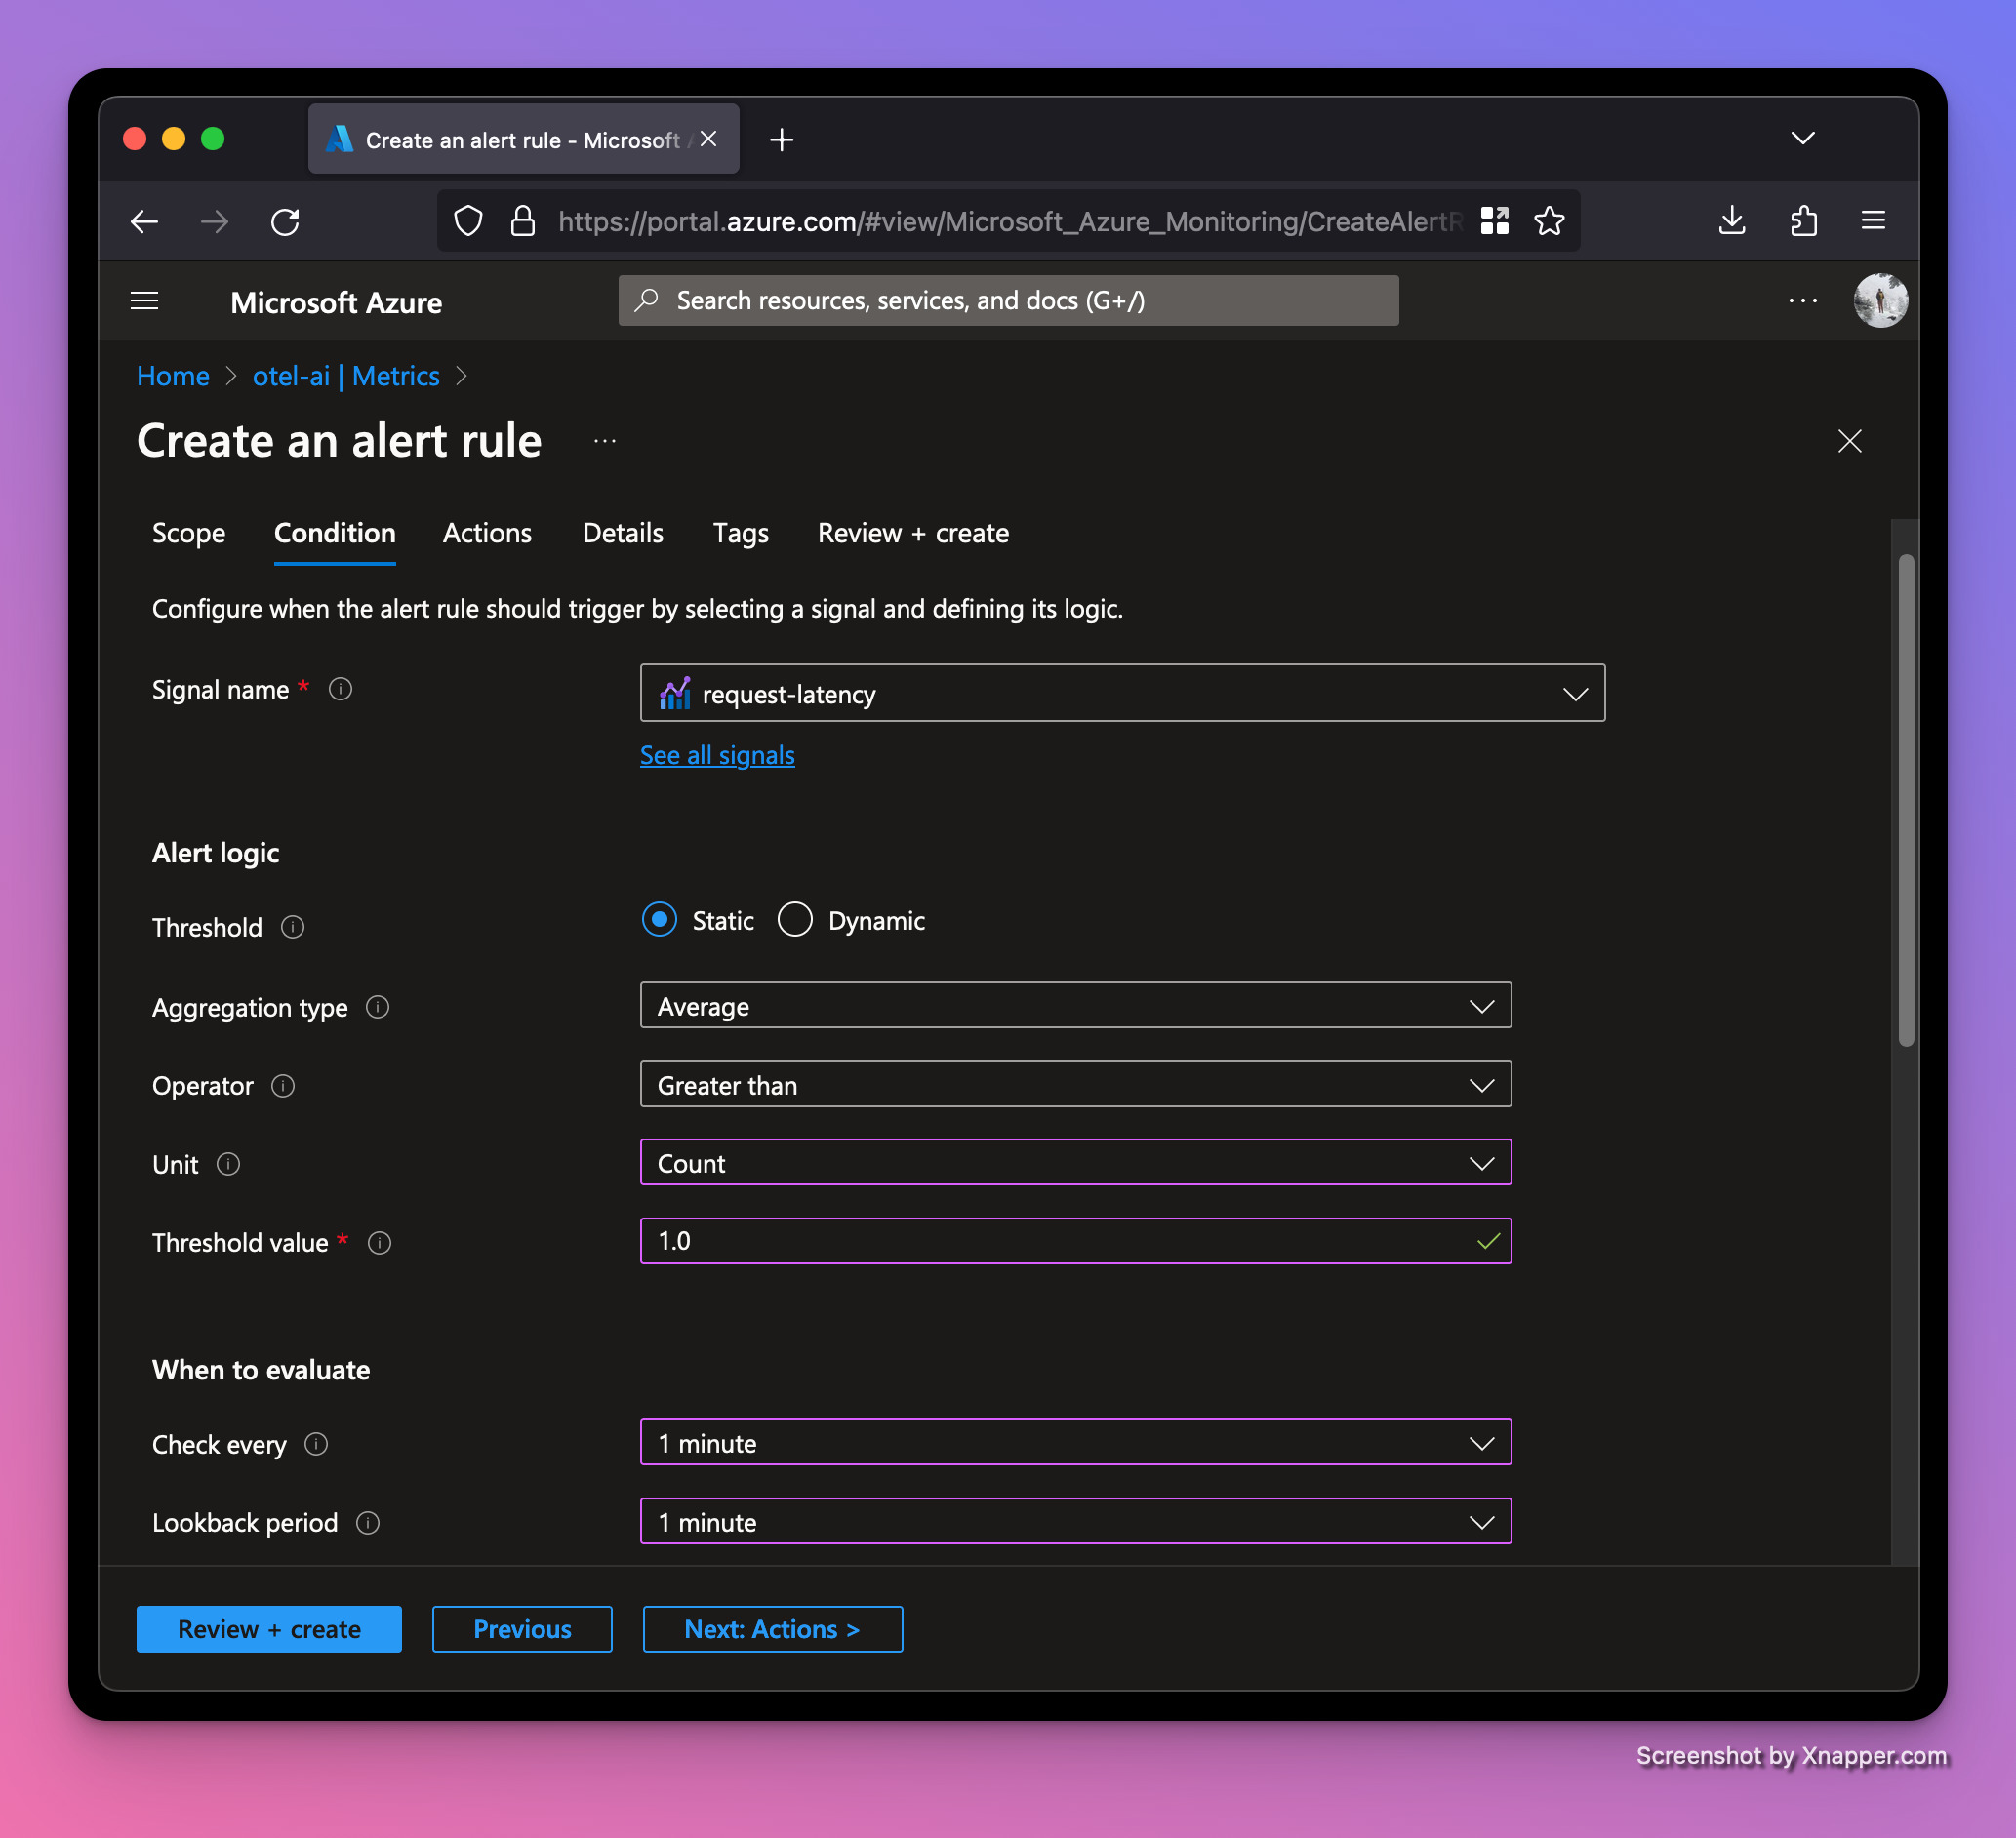
Alerts
Let’s set up a metrics alert rule to notify if our server begins taking too long to respond to requests. We'll use the request-latency histogram with a threshold of one second. Click the "New alert rule" button on the same page.
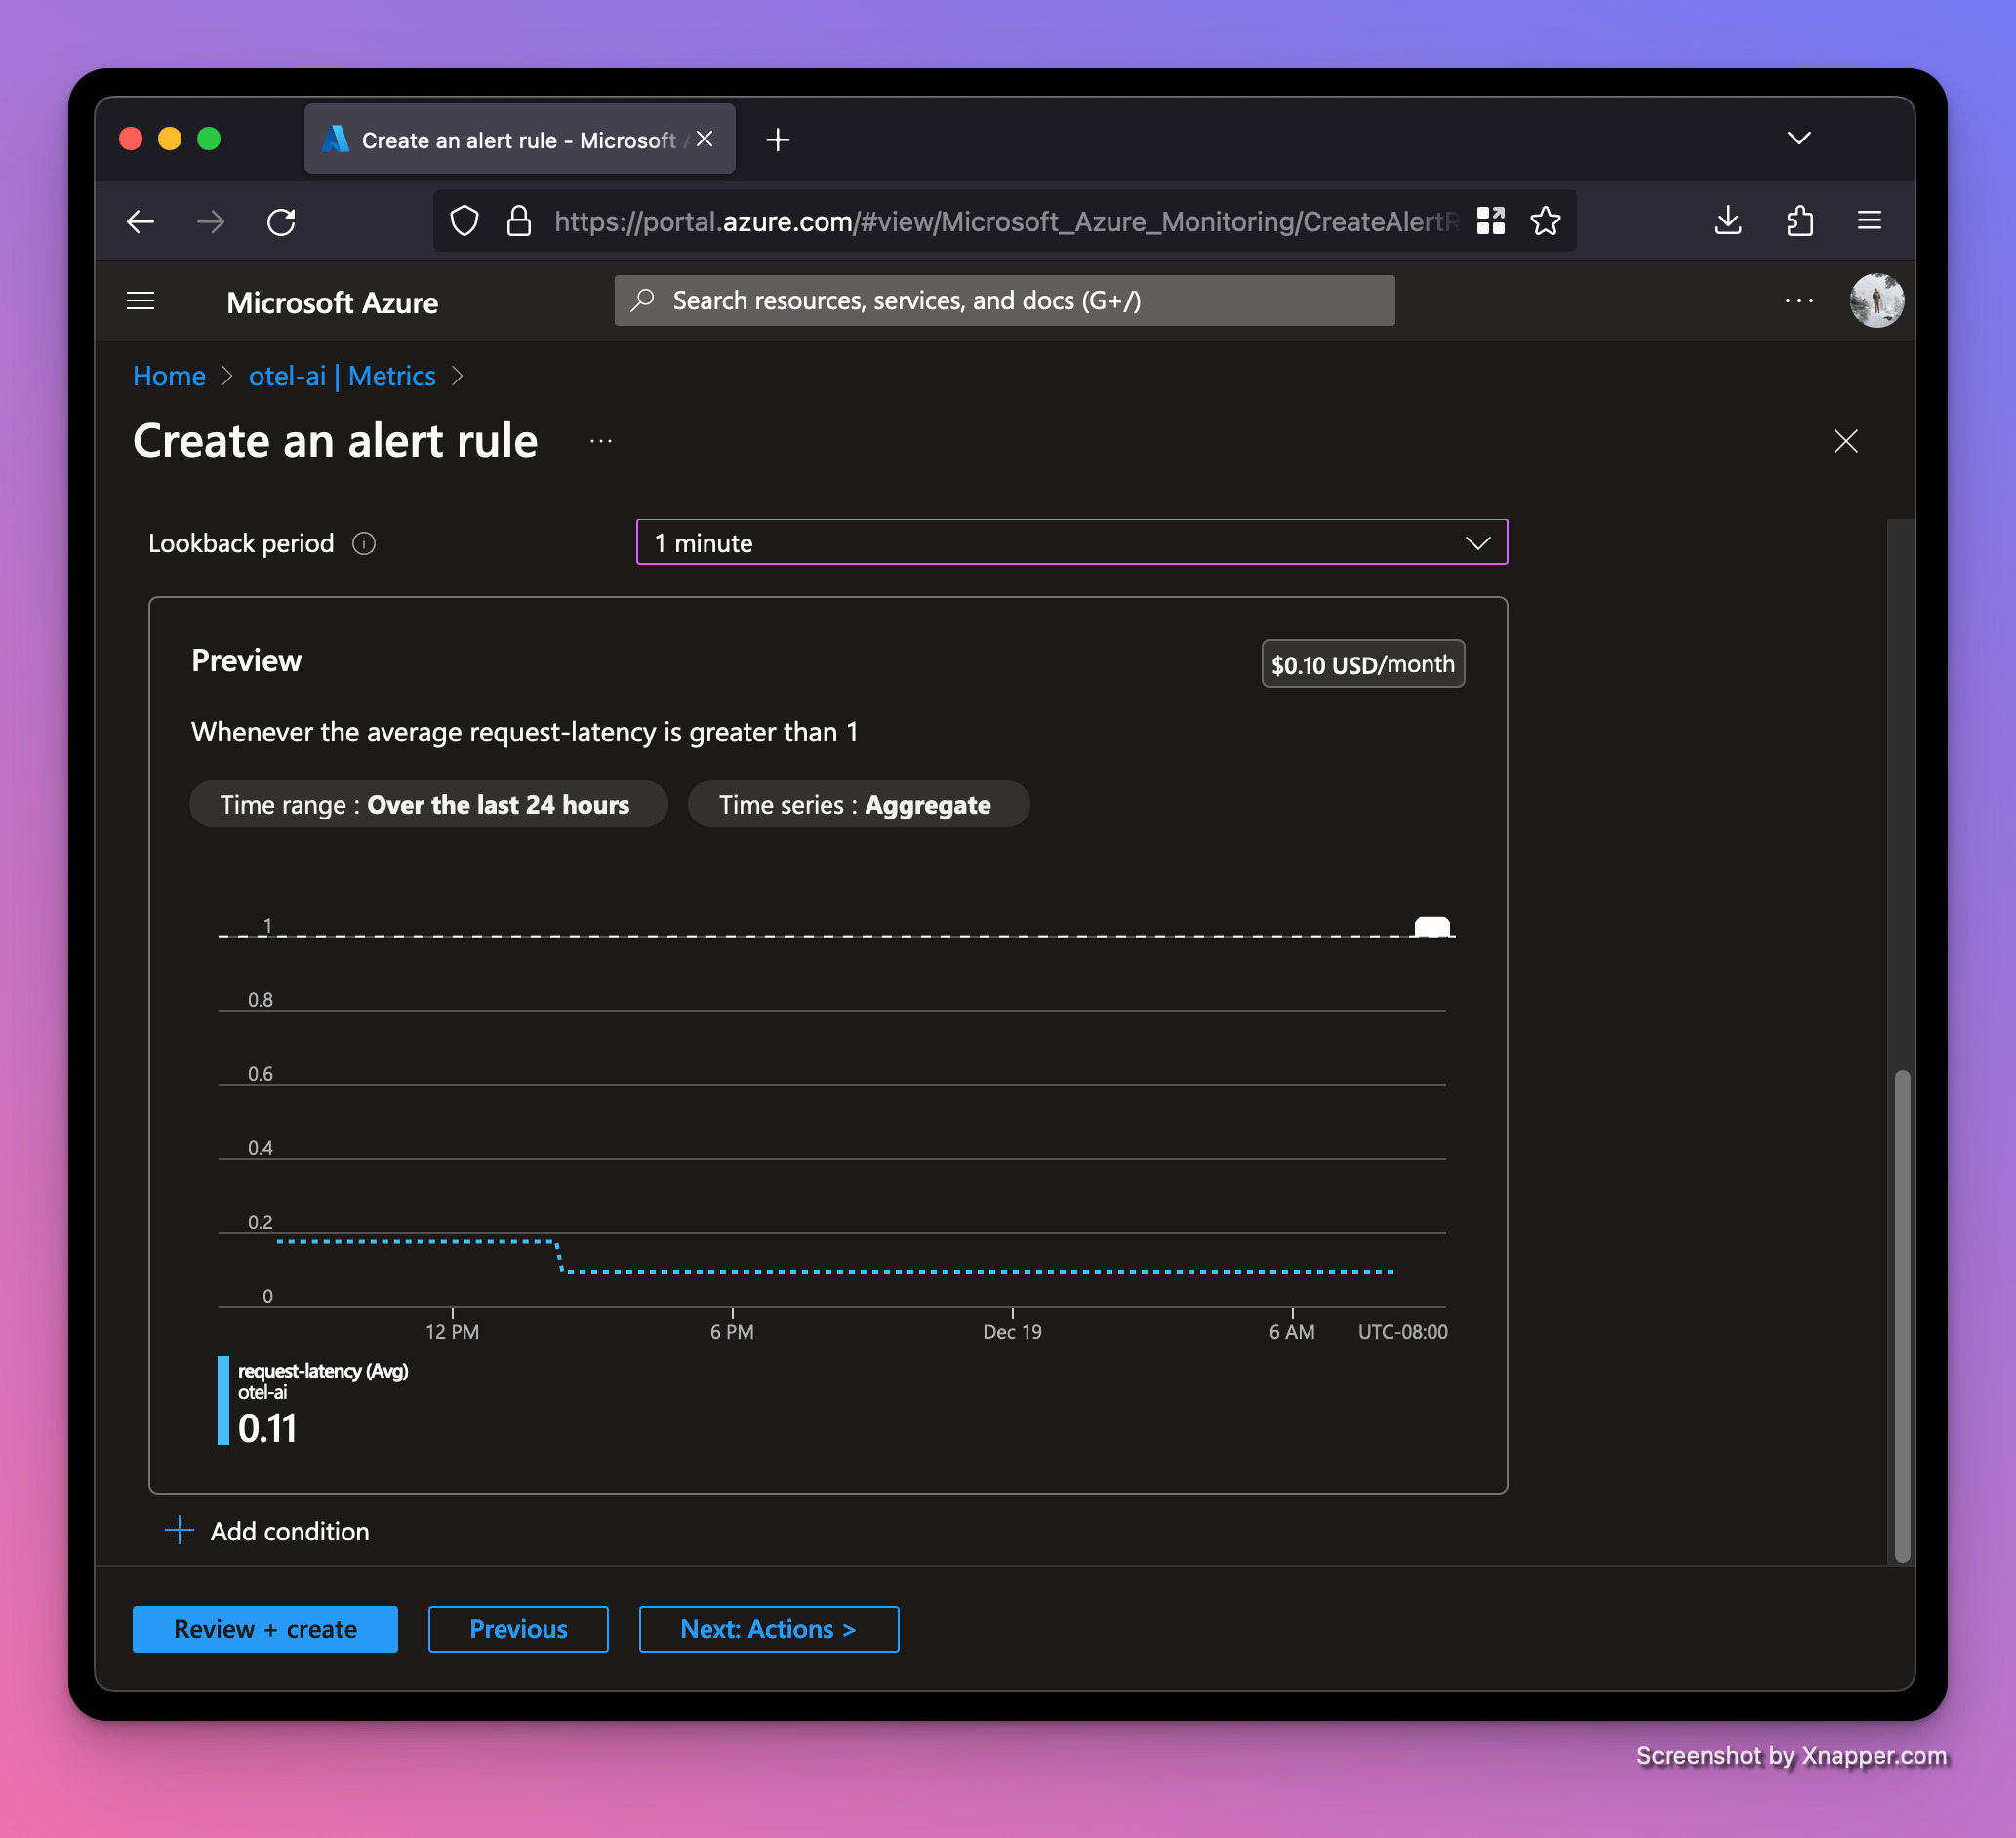
The preview shows that so far our traffic is performing well under the one second threshold for our alert to trigger.
Let’s add some random latency to our request handler:
...
def get_naughty_or_nice(name: str):
counter.add(1, {"name": name})
time.sleep(random.randint(0, 3)) # sleep between 0-3 seconds
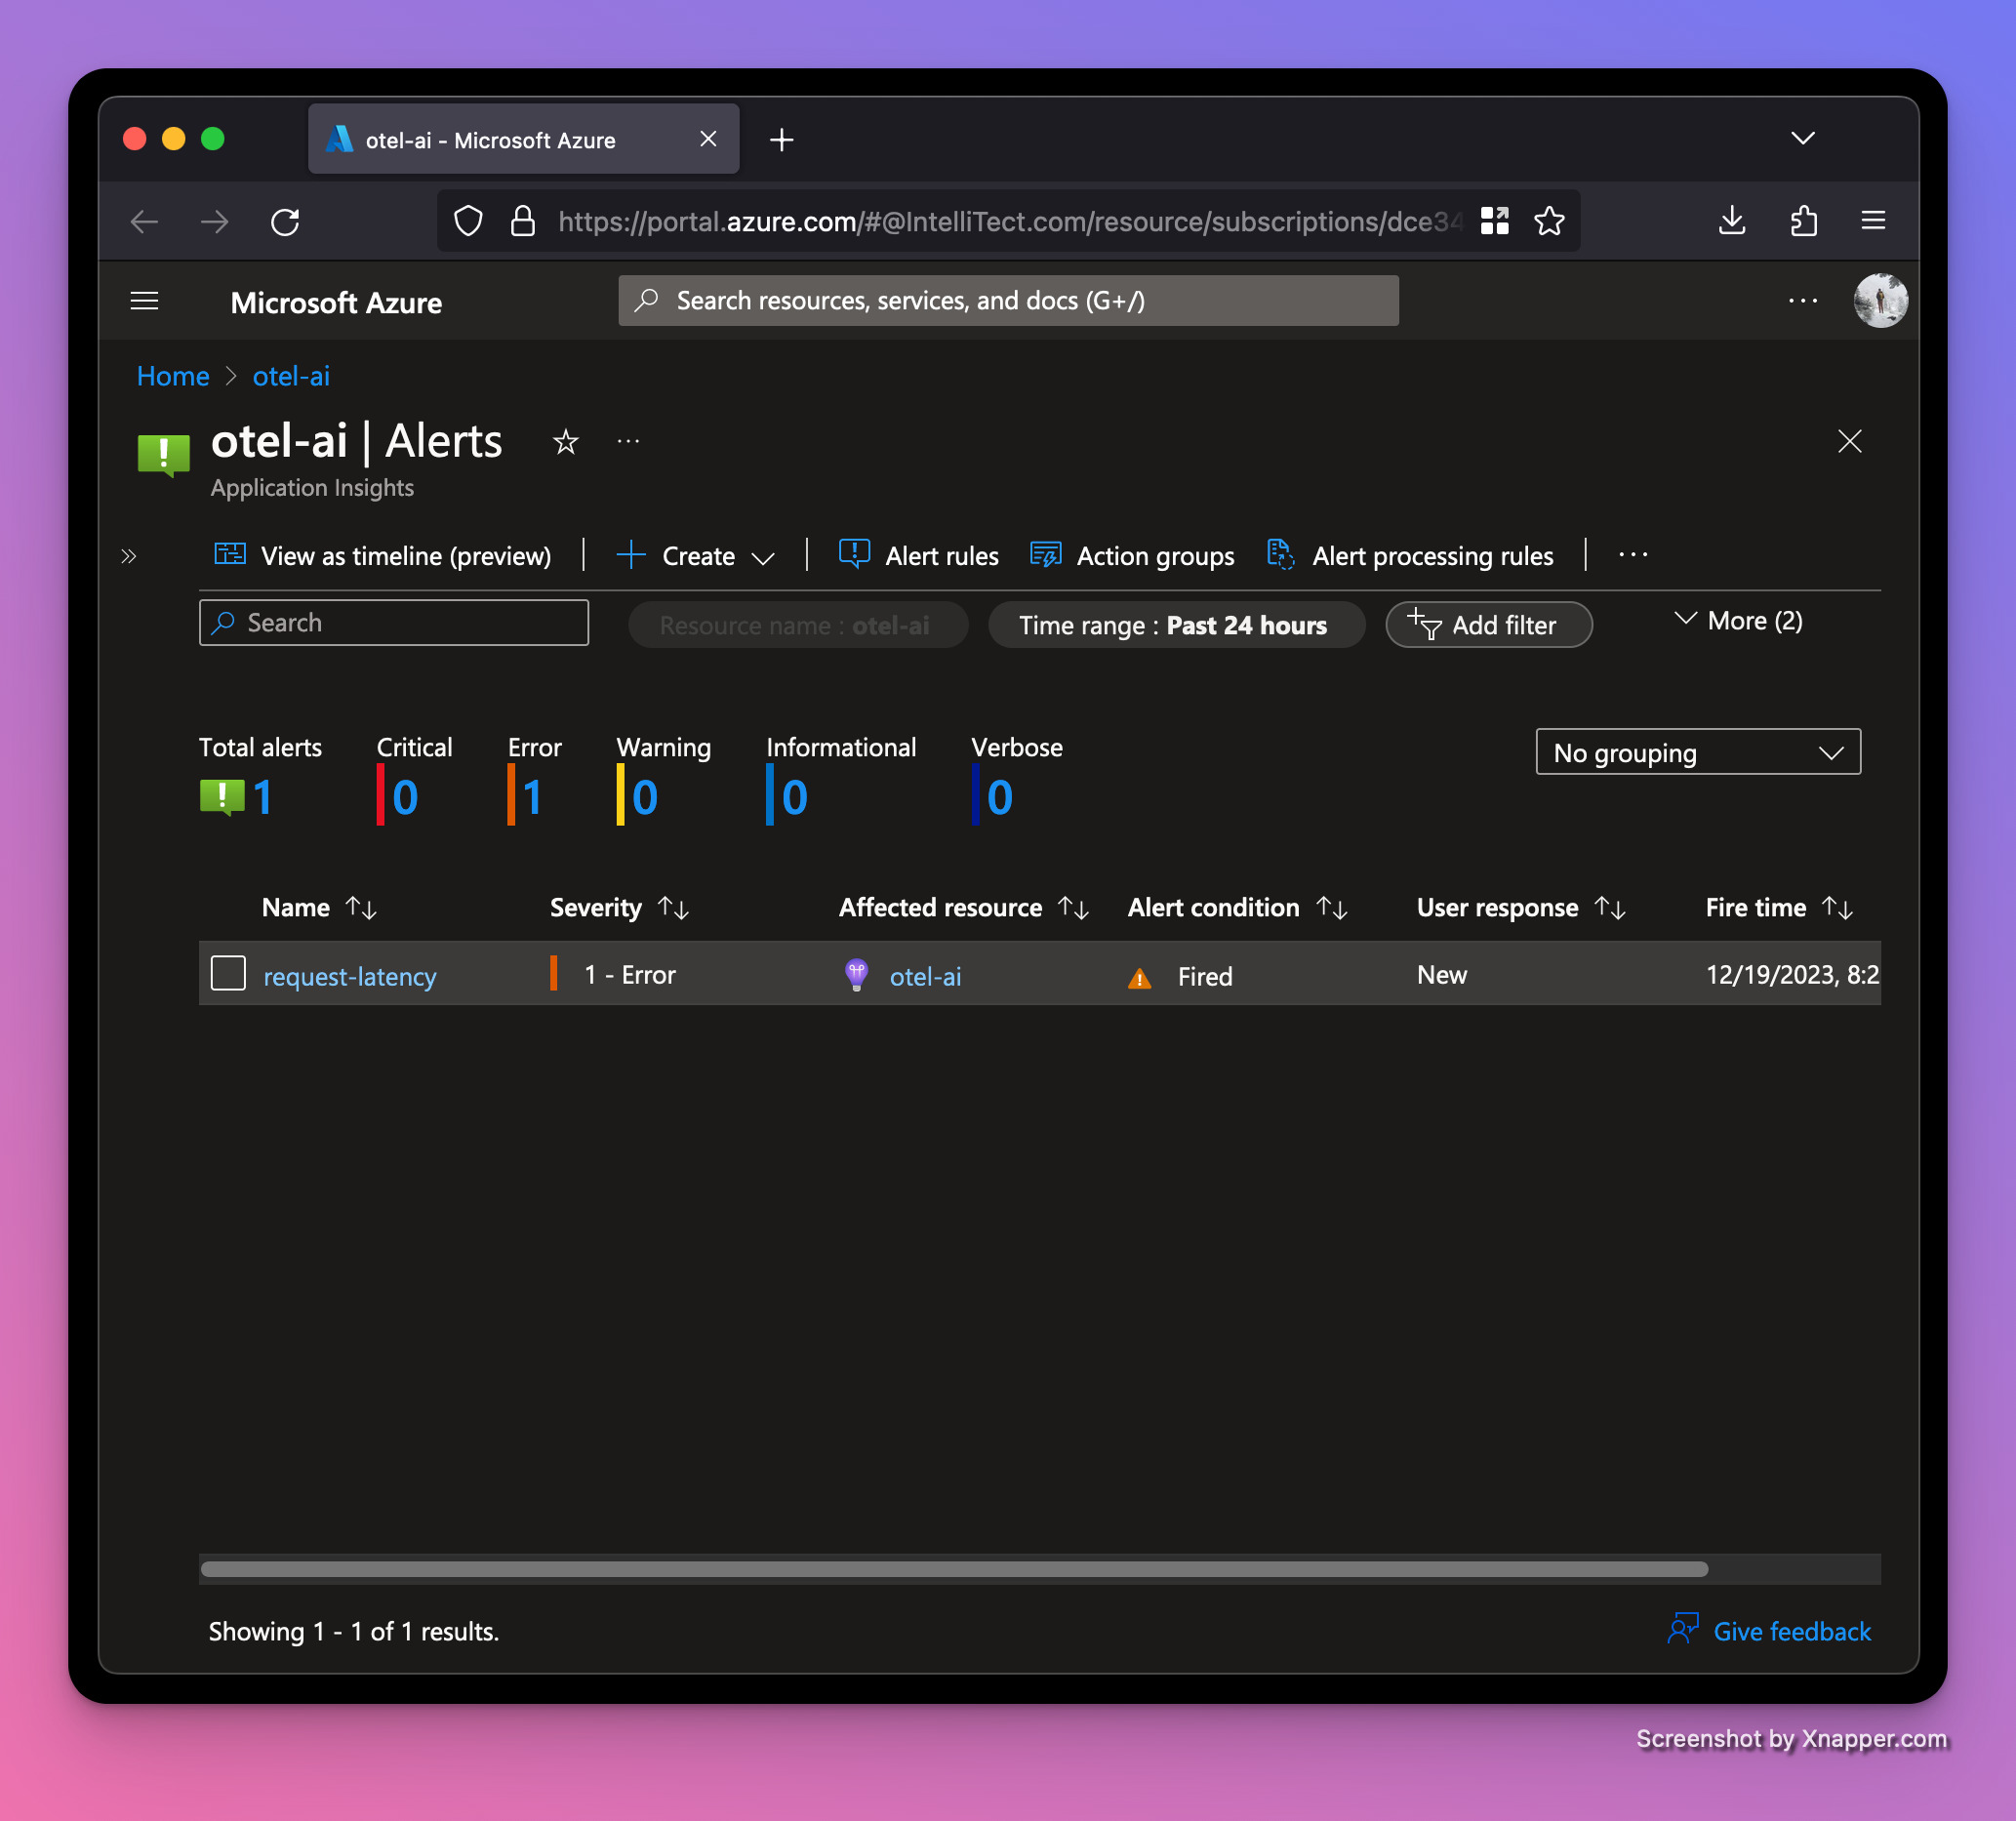
...Then restart the web server and trigger a few requests. After a minute, we should see an alert was triggered. This page can be found by clicking Alerts under the Monitoring section on the left navbar.
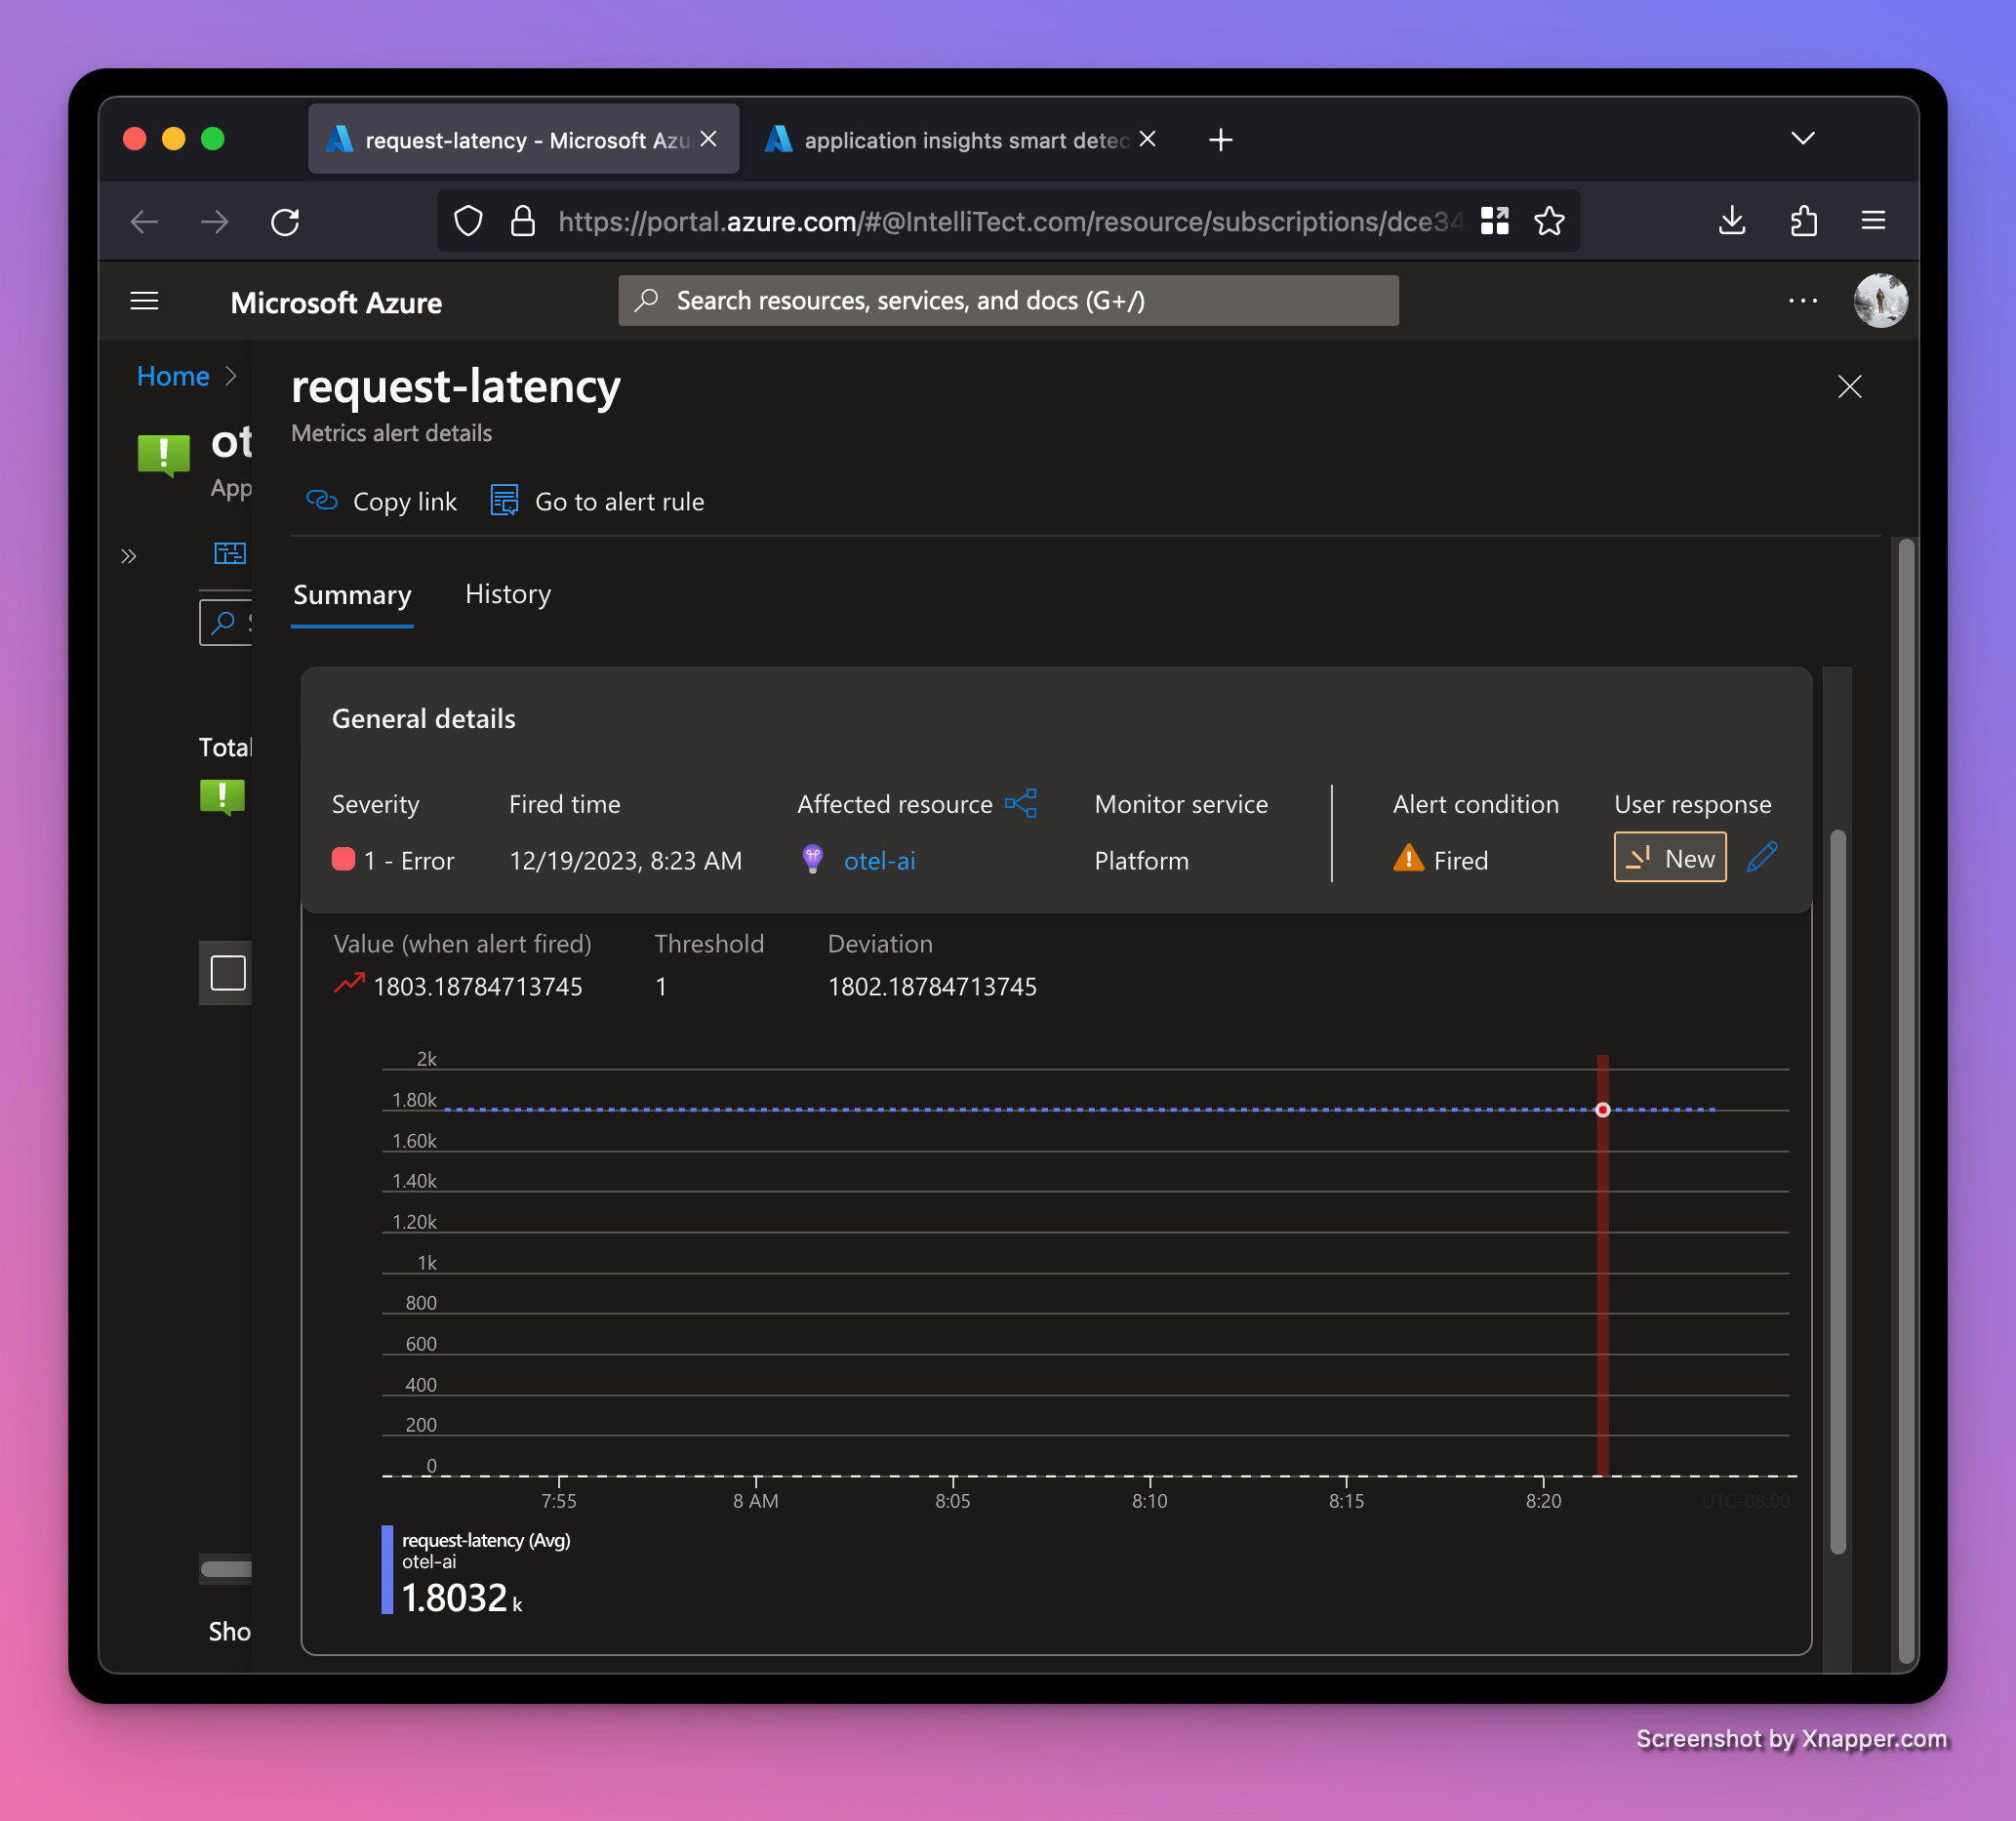
Our average latency is up to a whopping 1.8 seconds! Good thing we set up an alert!
Recap
Today we’ve learned a little bit about OpenTelemetry and why metrics are important. Metrics help you monitor the health of your software system and forecast issues. Distributed Systems Observability is a great resource to learn more about building observability into your software.
We also saw how to leverage FastAPI to create a simple web app. FastAPI leverages type hints for an enhanced developer experience. If Python’s type hints are new to you, check out how to shift left with type hints in Python.
Happy holidays and may your metrics alerts notify you of impending outages before Christmas day. Cheers.